

Question: Please assist with c) d) e): This question explores some of the points discussed in Topic 3 (Romer model). It is also designed to test
Please assist with c) d) e):
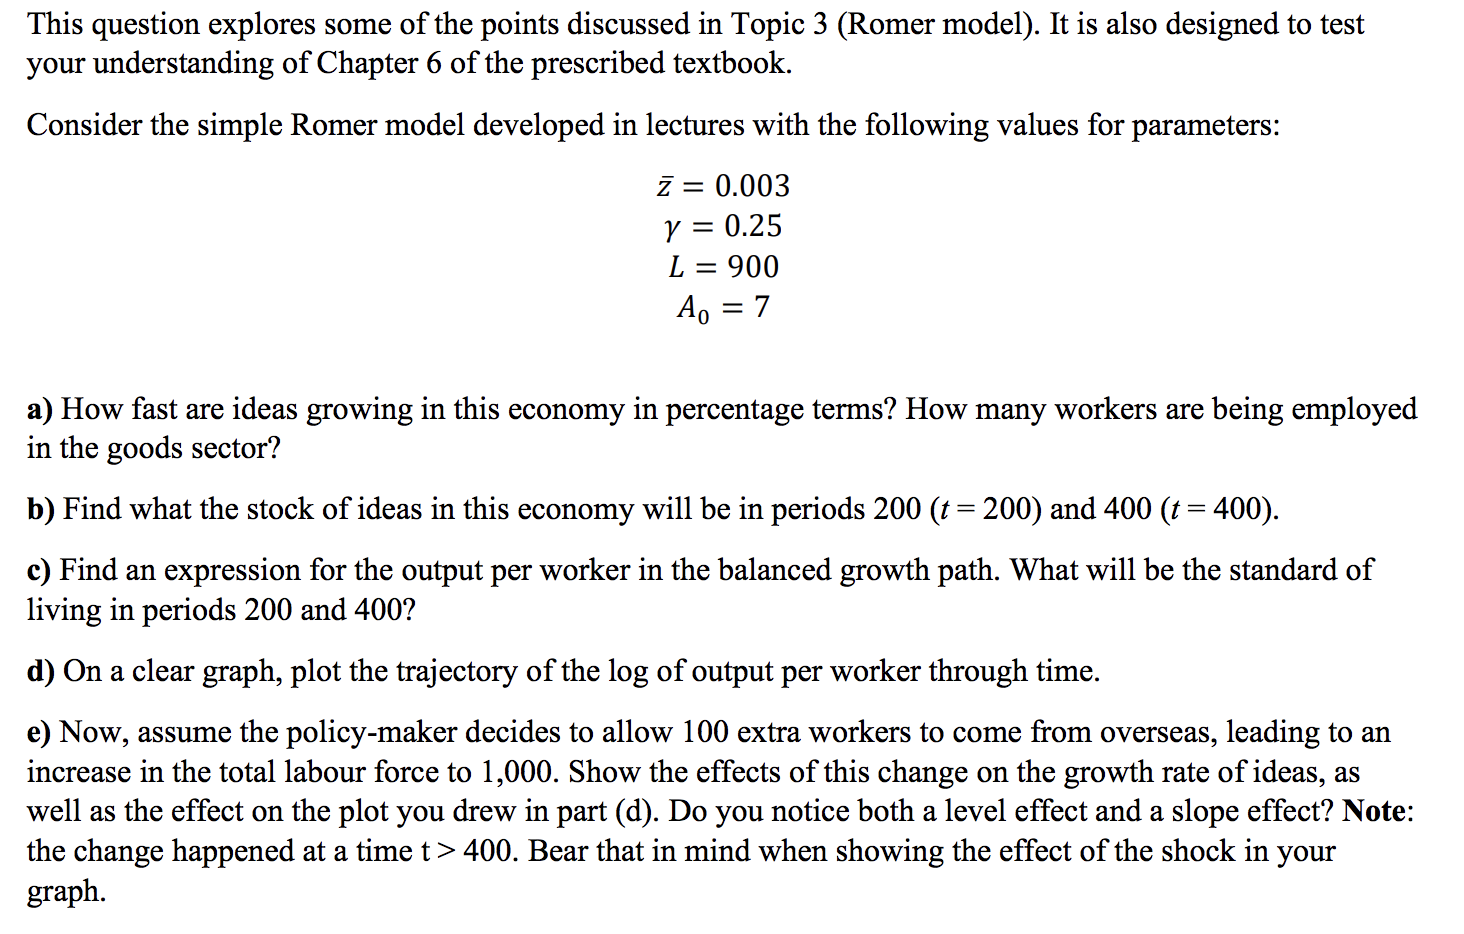
This question explores some of the points discussed in Topic 3 (Romer model). It is also designed to test your understanding of Chapter 6 of the prescribed textbook. Consider the simple Romer model developed in lectures with the following values for parameters: Z: 0.003 r = 0.25 L = 900 A0 = 7 a) How fast are ideas growing in this economy in percentage terms? How many workers are being employed in the goods sector? b) Find what the stock of ideas in this economy will be in periods 200 (r = 200) and 400 (t = 400). c) Find an expression for the output per worker in the balanced growth path. What will be the standard of living in periods 200 and 400? d) On a clear graph, plot the trajectory of the log of output per worker through time. e) Now, assume the policy-maker decides to allow 100 extra workers to come from overseas, leading to an increase in the total labour force to 1,000. Show the effects of this change on the grth rate of ideas, as well as the effect on the plot you drew in part ((1). Do you notice both a level effect and a slope effect? Note: the change happened at a time t > 400. Bear that in mind when showing the effect of the shock in your graph
Step by Step Solution
There are 3 Steps involved in it

Get step-by-step solutions from verified subject matter experts