

Question: Please assist with question 1, 2, and 3 Listed below are numbers of Internet users per 100 people and numbers of scientific award winners per
Please assist with question 1, 2, and 3
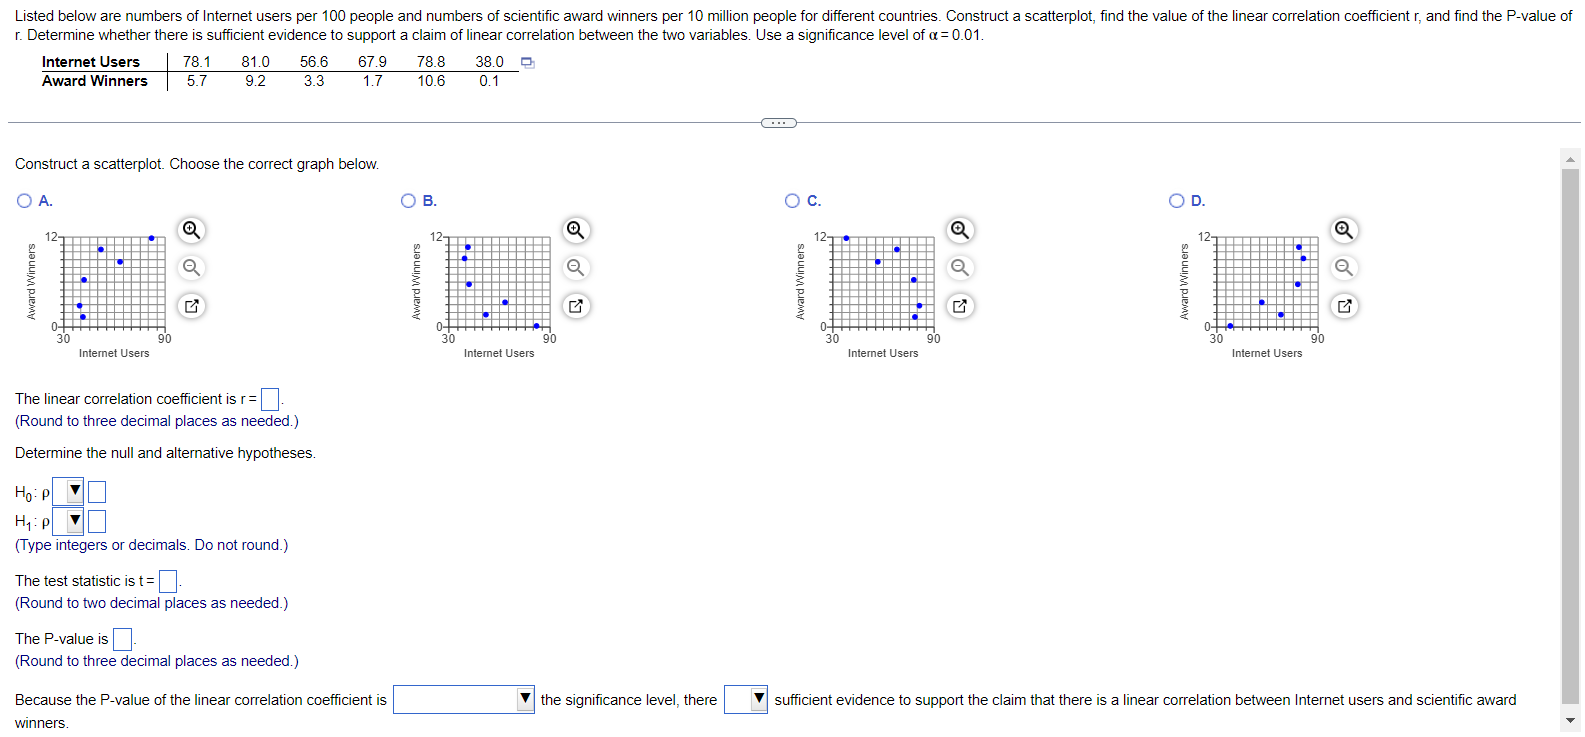
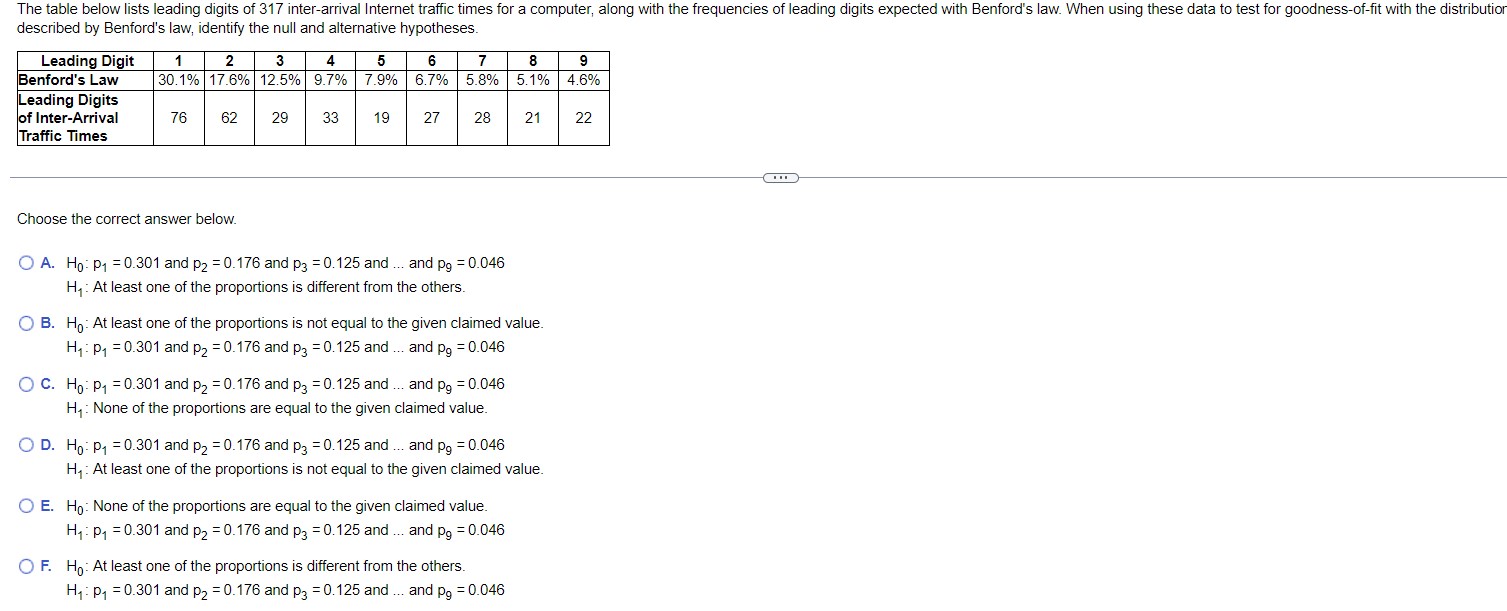
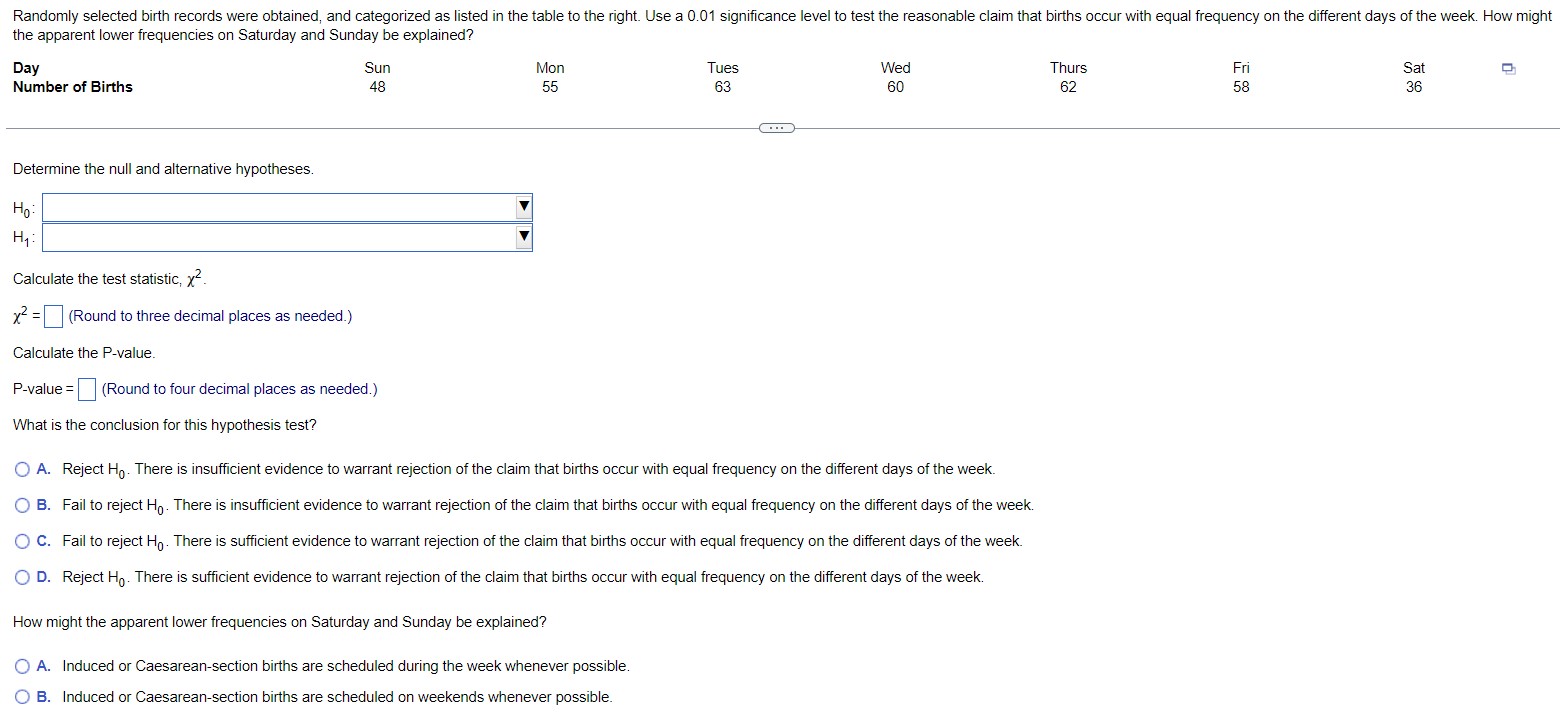
Listed below are numbers of Internet users per 100 people and numbers of scientific award winners per 10 million people for different countries. Consiruct a scatterplot, find the value of the linear correlation coefficient r, and find the P-value of r. Determine whether there is sufficient evidence to support a claim of linear correlation between the two variables. Use a significance level of a=0.01 Internet Users | 78.1 81.0 56.6 67.9 788 380 Award Winners | 57 9.2 33 17 1086 01 Construct a scatterplot. Choose the correct graph below. - O A O B. Qc. oD 12 o & Q e Hs H e e 2 - 2 2 S a Q i H i o i H 30 90 30 90 Intemet Users Intemet Users Intemet Users Intemet Users The linear correlation coefficientis r= (Round to three decimal places as needed.) Determine the null and alternative hypotheses. Hop| Hyp (Type integers or decimals. Do not round.) The test statistic is t = (Round to two decimal places as needed.) The P-valuz is | | (Round to three decimal places as needed.) Because the P-value of the linear correlation ceefficient is the significance level, there | sufiicient evidence to support the claim that there is a linear correlation between Internet users and scientific award winners. - The table below lists leading digits of 317 inter-arrival Internet traffic times for a computer, along with the frequencies of leading digits expected with Benford's law. When using these data to test for goodness-of-fit with the distribution described by Benford's law, identify the null and alternative hypotheses Leading Digit 2 3 5 6 8 9 Benford's Law 30.1% 17.6% 12.5% 9.7% 7.9% 6.7% 5.8% 5.1% 4.6% Leading Digits of Inter-Arrival 76 62 29 33 19 27 28 21 22 Traffic Times Choose the correct answer below. O A. Ho: P1 = 0.301 and p2 = 0.176 and p3 = 0.125 and ... and pg = 0.046 Hy : At least one of the proportions is different from the others. O B. Ho: At least one of the proportions is not equal to the given claimed value. H1: py = 0.301 and p2 = 0.176 and p3 = 0.125 and ... and pg = 0.046 O C. Ho: P1 = 0.301 and p2 = 0.176 and p3 = 0.125 and ... and pg = 0.046 Hy : None of the proportions are equal to the given claimed value. O D. Ho: P1 = 0.301 and p2 = 0.176 and p3 = 0.125 and ... and pg = 0.046 Hy : At least one of the proportions is not equal to the given claimed value. O E. Ho: None of the proportions are equal to the given claimed value. Hy: P1 = 0.301 and p2 = 0.176 and p3 = 0.125 and ... and pg = 0.046 OF. Ho: At least one of the proportions is different from the others. H1: P1 = 0.301 and p2 = 0.176 and p3 = 0.125 and .. and pg = 0.046Randomly selected birth records were obtained, and categorized as listed in the table to the right. Use a 0.01 significance level to test the reasonable claim that births occur with equal frequency on the different days of the week. How might the apparent lower frequencies on Saturday and Sunday be explained? Day Sun Mon Tues Wed Thurs Fri Sat o Number of Births 48 55 63 60 62 58 36 Determine the null and alternative hypotheses. Hy: Hy: Calculate the test statistic, )(2 )(2 = (Round to three decimal places as needed ) Calculate the P-value. P-value = (Round to four decimal places as needed.) What is the conclusion for this hypothesis test? () A. Reject Hy. There is insufficient evidence to warrant rejection of the claim that births occur with equal frequency on the different days of the week. () B. Fail to reject Hy. There is insufficient evidence to warrant rejection of the claim that births occur with equal frequency on the different days of the week () C. Fail to reject Hy. There is sufficient evidence to warrant rejection of the claim that births occur with equal frequency on the different days of the week. (O D. Reject Hy. There is sufficient evidence to warrant rejection of the claim that births occur with equal frequency on the different days of the week How might the apparent lower frequencies on Saturday and Sunday be explained? (O A. Induced or Caesarean-section births are scheduled during the week whenever possible. (O B. Induced or Caesarean-section births are scheduled on weekends whenever possible
Step by Step Solution
There are 3 Steps involved in it

Get step-by-step solutions from verified subject matter experts