

Question: Please assist with questions. 11 & 12 link for question 11 : https://docs.google.com/spreadsheets/d/1mDOHaC5UMUw-9ilf7FiGLCZL9aH0F4pfDUmlDqK7zv0/edit?usp=sharing 11 Daily Spot Exchange Rate, U.S. Dollars per Pound Sterling Date Rate
Please assist with questions. 11 & 12
link for question 11 : https://docs.google.com/spreadsheets/d/1mDOHaC5UMUw-9ilf7FiGLCZL9aH0F4pfDUmlDqK7zv0/edit?usp=sharing
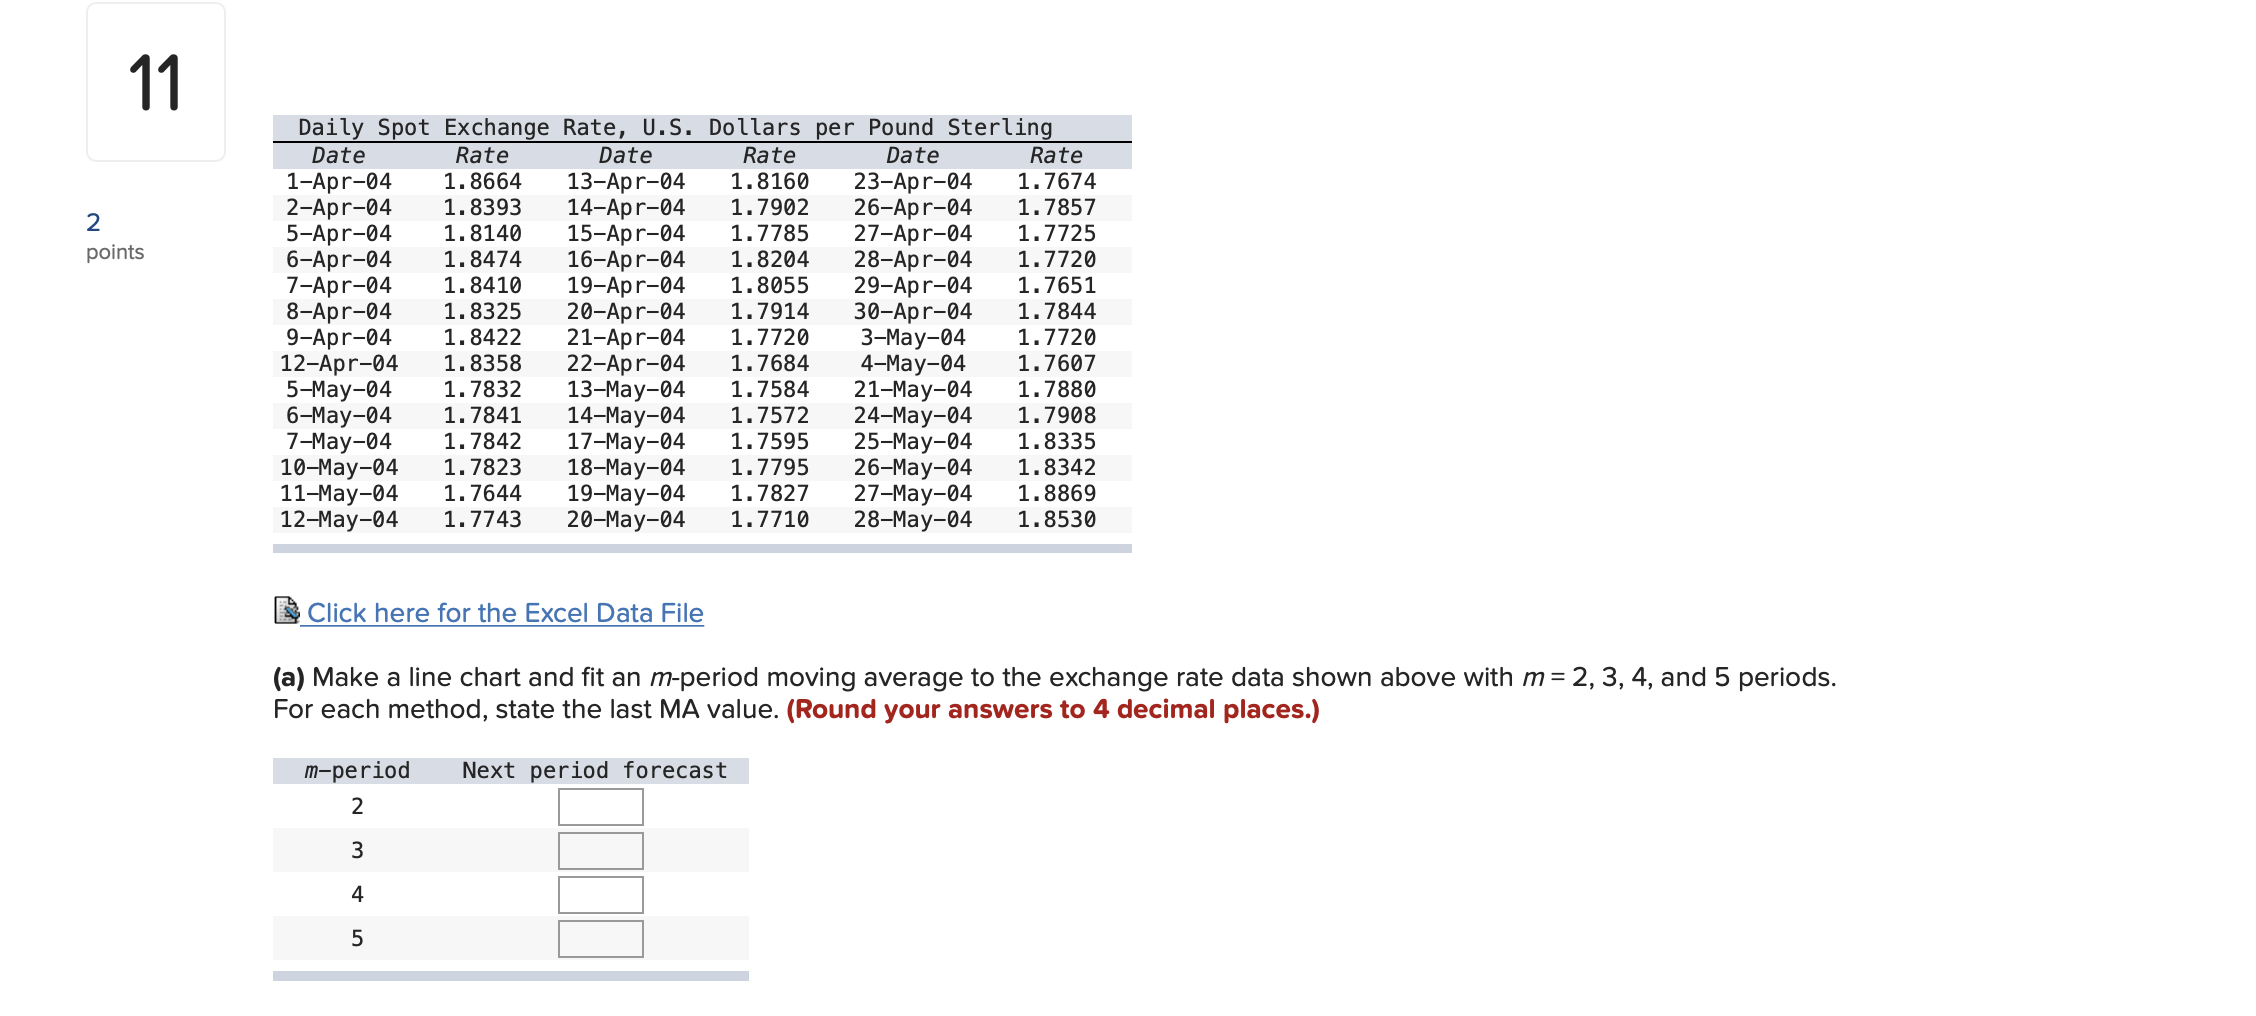
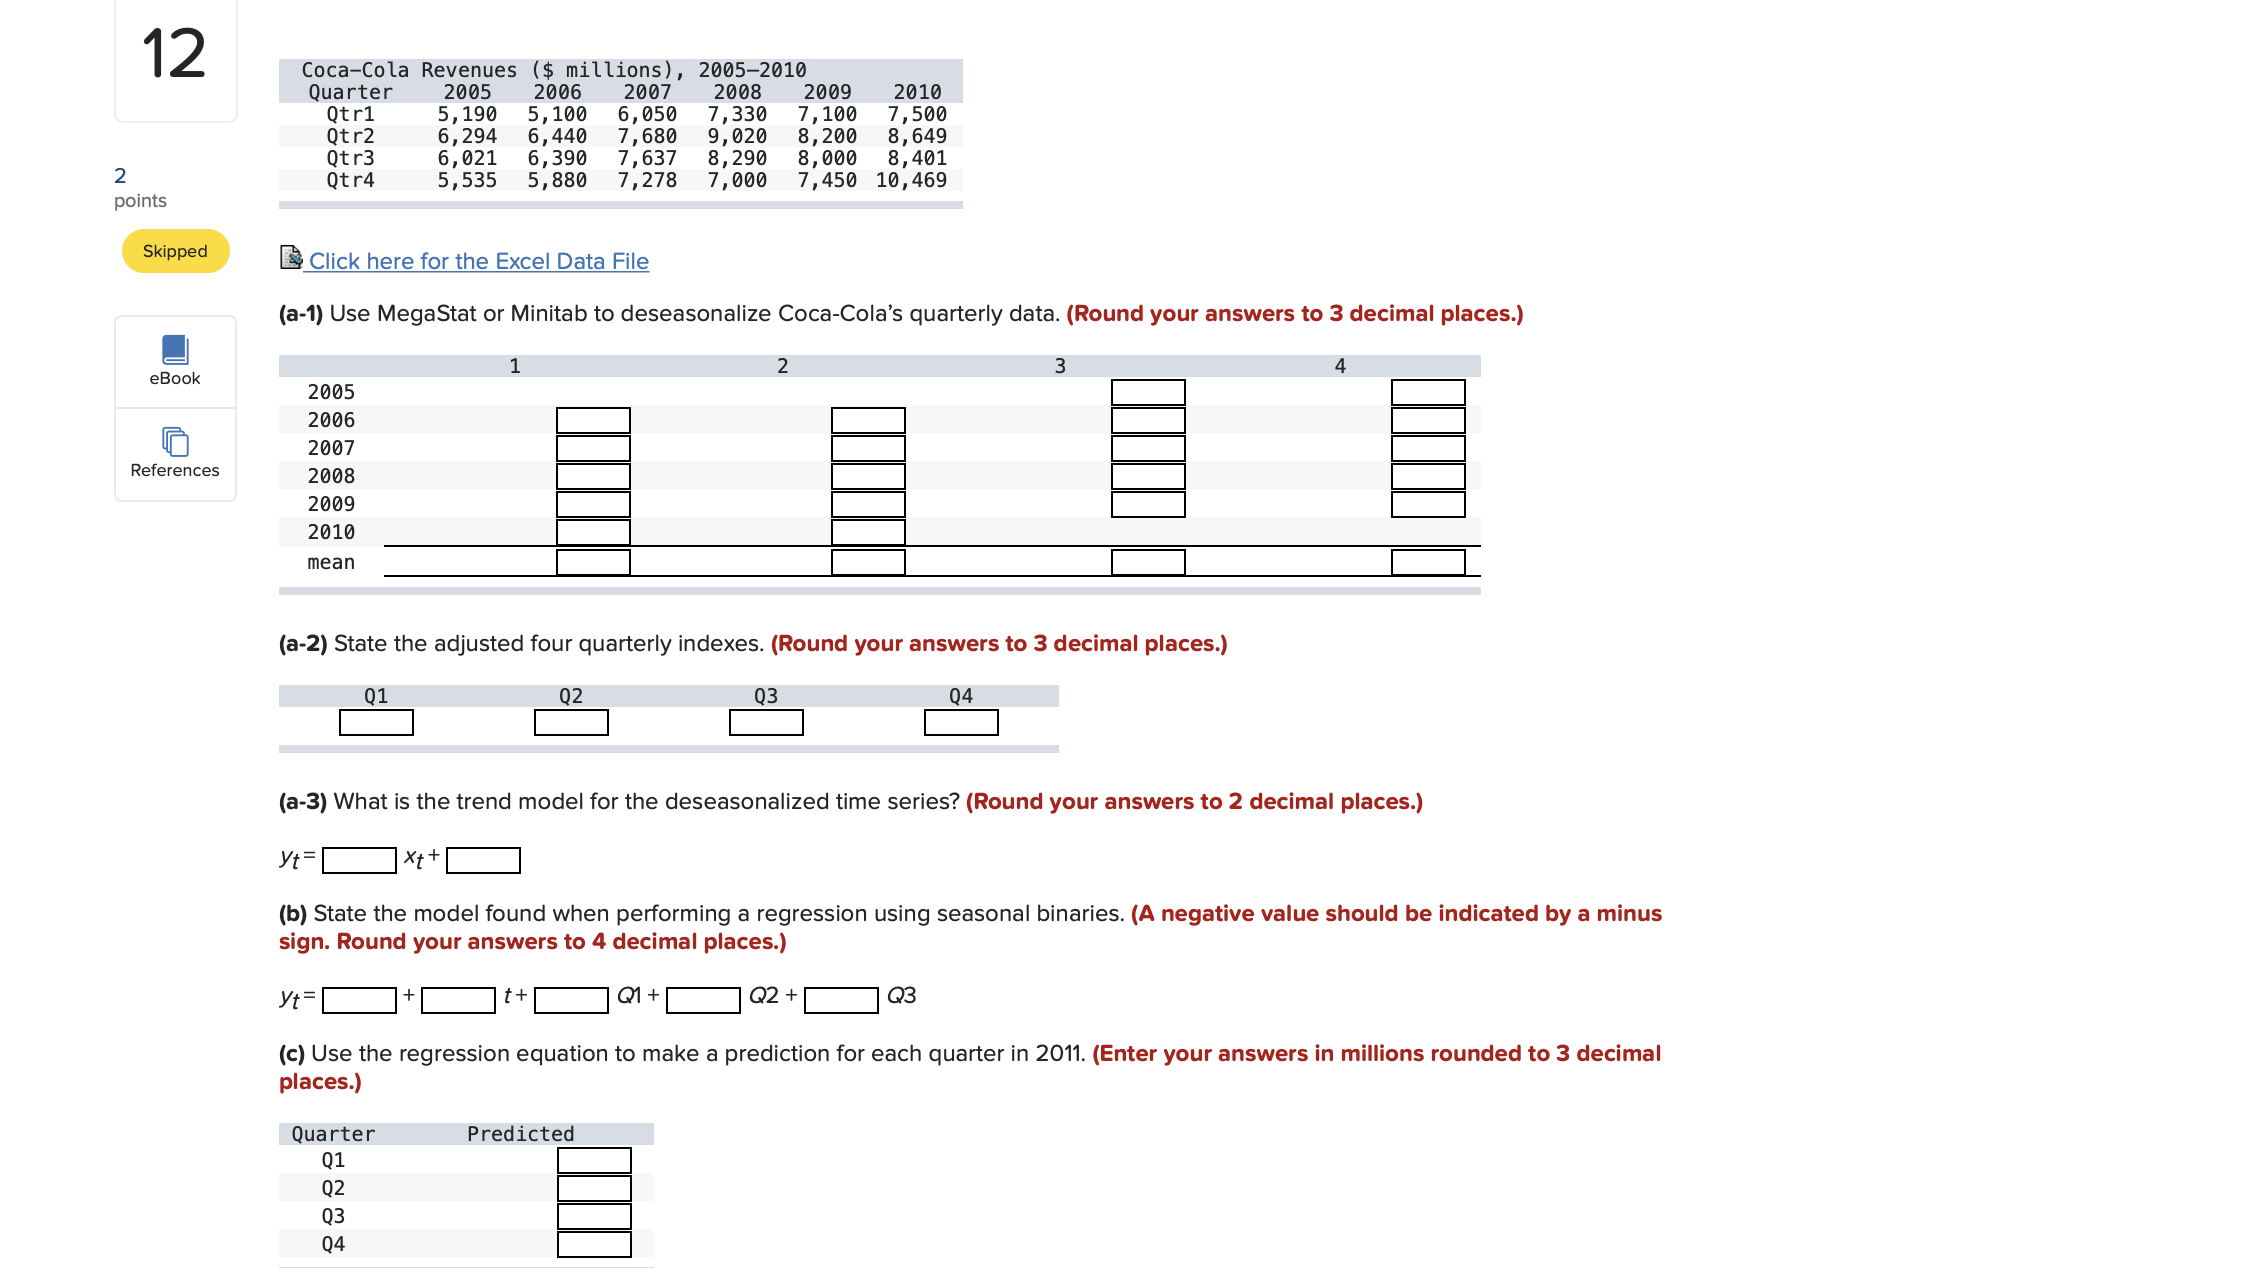
11 Daily Spot Exchange Rate, U.S. Dollars per Pound Sterling Date Rate Date Rate Date Rate 1-Apr-04 1. 8664 13-Apr-04 1. 8160 23-Apr-04 1. 7674 2-Apr-04 1. 8393 14-Apr-04 1. 7902 26-Apr-04 1. 7857 2 5-Apr-04 1. 8140 15-Apr-04 1. 7785 27-Apr-04 1. 7725 points 6-Apr-04 1. 8474 16-Apr-04 1. 8204 28-Apr-04 1. 7720 7-Apr-04 1. 8410 19-Apr-04 1. 8055 29-Apr-04 1. 7651 8-Apr-04 1. 8325 20-Apr-04 1. 7914 30-Apr-04 1. 7844 9-Apr-04 1. 8422 21-Apr-04 1. 7720 3-May-04 1. 7720 12-Apr-04 1. 8358 22-Apr-04 1. 7684 4-May-04 1. 7607 5-May-04 1. 7832 13-May-04 1. 7584 21-May-04 1. 7880 6-May-04 1. 7841 14-May-04 1. 7572 24-May-04 1. 7908 7-May-04 1. 7842 17-May-04 1. 7595 25-May-04 1.8335 10-May-04 1. 7823 18-May-04 1. 7795 26-May-04 1. 8342 11-May-04 1. 7644 19-May-04 1. 7827 27-May-04 1. 8869 12-May-04 1. 7743 20-May-04 1. 7710 28-May-04 1. 8530 Click here for the Excel Data File (a) Make a line chart and fit an m-period moving average to the exchange rate data shown above with m = 2, 3, 4, and 5 periods. For each method, state the last MA value. (Round your answers to 4 decimal places.) m-period Next period forecast 2 W12 Coca-cola Revenues ($ millions ), 2005-2010 Quarter 2005 2006 2007 2008 2009 2010 Qtr1 5, 190 5, 100 6, 050 7,330 7, 100 7,500 Qtr2 6, 294 6, 440 7, 680 9, 020 8, 200 8, 649 Qtr3 6, 021 6,390 7, 637 8, 290 8, 000 8, 401 2 Qtr4 5,535 5, 880 7,278 7,000 7, 450 10, 469 points Skipped Click here for the Excel Data File (a-1) Use MegaStat or Minitab to deseasonalize Coca-Cola's quarterly data. (Round your answers to 3 decimal places.) 2 3 4 eBook 2005 2006 2007 References 2008 2009 2010 mean (a-2) State the adjusted four quarterly indexes. (Round your answers to 3 decimal places.) Q1 Q2 Q3 Q4 (a-3) What is the trend model for the deseasonalized time series? (Round your answers to 2 decimal places.) ytxt + (b) State the model found when performing a regression using seasonal binaries. (A negative value should be indicated by a minus sign. Round your answers to 4 decimal places.) yt =tot 101+Q2+ Q3 (c) Use the regression equation to make a prediction for each quarter in 2011. (Enter your answers in millions rounded to 3 decimal places.) Quarter Predicted Q1 Q2 Q3 04
Step by Step Solution
There are 3 Steps involved in it

Get step-by-step solutions from verified subject matter experts