

Question: please assist with the calculations on the table below: Using the following time series data of U.S. new car sales ($ millions), respond to the
please assist with the calculations on the table below:
Using the following time series data of U.S. new car sales ($ millions), respond to the following items. (The data is sourced from https://www.census.gov/retail/index.html#mrts. Find "Monthly Retail Trade Report," then select "Time Series/Trend Charts" to find the data for U.S. new car sales.).
DATA:
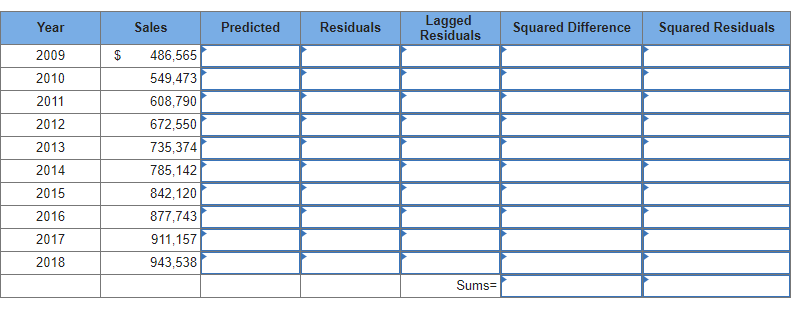
Year Sales ($ Millions)
2009 $486,565
2010 549,473
2011 608,790
2012 672,550
2013 735,374
2014 785,142
2015 842,120
2016 877,743
2017 911,157
2018 943,538
b.Test for autocorrelation using the 0.05 significance level.(Negative amounts should be indicated by a minus sign. Round your answers to 2 decimal places.)
\f
Step by Step Solution
There are 3 Steps involved in it

Get step-by-step solutions from verified subject matter experts