

Question: Please assist with this question with thorough answering and help understand the creation of X and R charts. I want to understand this material. 1)
Please assist with this question with thorough answering and help understand the creation of X and R charts. I want to understand this material.
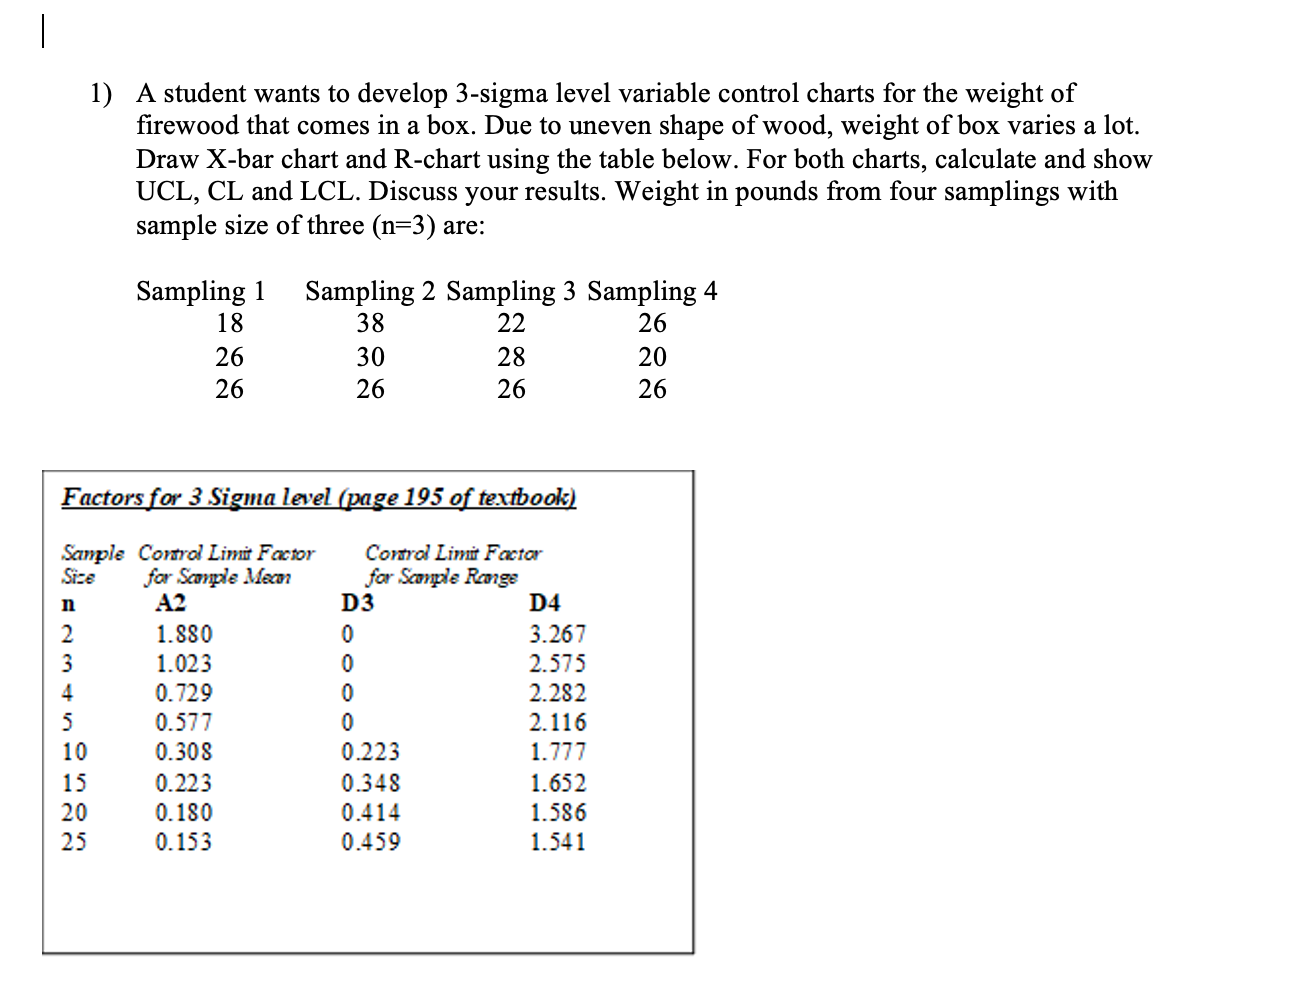
1) A student wants to develop 3-sigma level variable control charts for the weight of firewood that comes in a box. Due to uneven shape of wood, weight of box varies a lot. Draw X-bar chart and R-chart using the table below. For both charts, calculate and show UCL, CL and LCL. Discuss your results. Weight in pounds from four samplings with sample size of three (n=3) are: Sampling 1 Sampling 2 Sampling 3 Sampling 4 18 38 22 26 26 30 28 20 26 26 26 26 Factors for 3 Sigma level (page 195 of textbook) Sample Control Limit Factor Control Limit Factor Size for Scomple Mean for Scomple Range n A2 D3 D4 2 1.880 0 3.267 1.023 2.575 4 0.729 2.282 0.577 2.116 10 0.308 0.223 1.777 15 0.223 0.348 1.652 20 0.180 0.414 1.586 25 0.153 0.459 1.541
Step by Step Solution
There are 3 Steps involved in it

Get step-by-step solutions from verified subject matter experts