Question: please aswer all questions What does the red arrow indicate in the following box plot displaying the distribution of exam scores? Boxplot of Exam scores

please aswer all questions please aswer all questions What does the red
please aswer all questions What does the red
What does the red arrow indicate in the following box plot displaying the distribution of exam scores? Boxplot of Exam scores 20 30 40 50 70 80 90 60 Exam scores 100 O a 25th percentile Ob Median Oc 3rd quartile Od Outlier What is the arithmetic mean (rounded to two decimal places) in the following table for the variable score? Time left 0.25:28 Student ID Score R304110 0.98 R304003 0.88 R102234 0.65 R209939 0.92 O a 0.88 Ob 0.86 OC 0.92 O d. 0.76 What type of relationship is being displayed on the following scatter chart? O a Negative linear relationship Ob. No relationship Oc. Nonlinear relationship od Positive linear relationship The following chart is an example of a Half-Marathon Race Times Male Female oh 1 20 0 40 60 80 100 120 140 160 180 200 Minutes O a. frequency polygon O b. trellis display Oc strip chart O d. scatter chart The average monthly price of regular gasoline in the United States was recorded for the years 1998-2005. Each year's distribution of average monthly regular gasoline prices is shown in the following box plot Time left 0:24:40 U.S. Gas Prices by Year 300 250 Price in Cents 200 D 150 100 1990 1998 2000 2001 2002 2003 2004 2005 Which two consecutive years saw the least amount of change in monthly gasoline prices? O a 1999 - 2000 Ob 2001 - 2002 O c. 1998-1999 Od 2000-2001

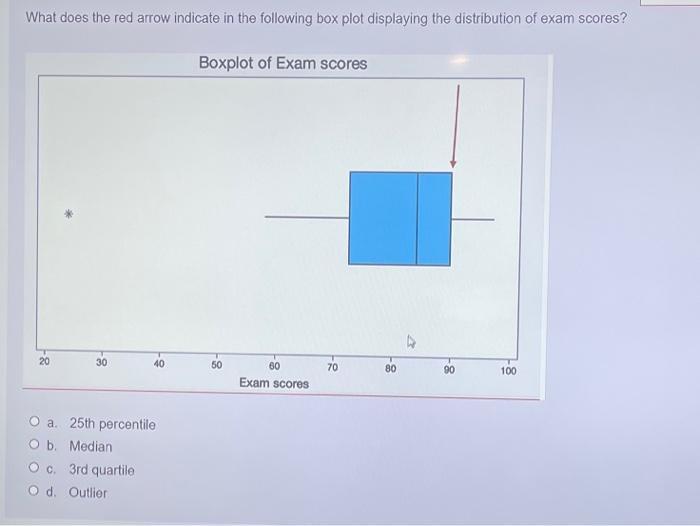
Step by Step Solution

There are 3 Steps involved in it

1 Expert Approved Answer
Step: 1 Unlock blur-text-image
Question Has Been Solved by an Expert!

Get step-by-step solutions from verified subject matter experts

Step: 2 Unlock
Step: 3 Unlock

Students Have Also Explored These Related General Management Questions!