

Question: please attach an EXCEL file Create a table in Excel and solve for the following: 1. What percentage of students had an overall grade above
please attach an EXCEL file
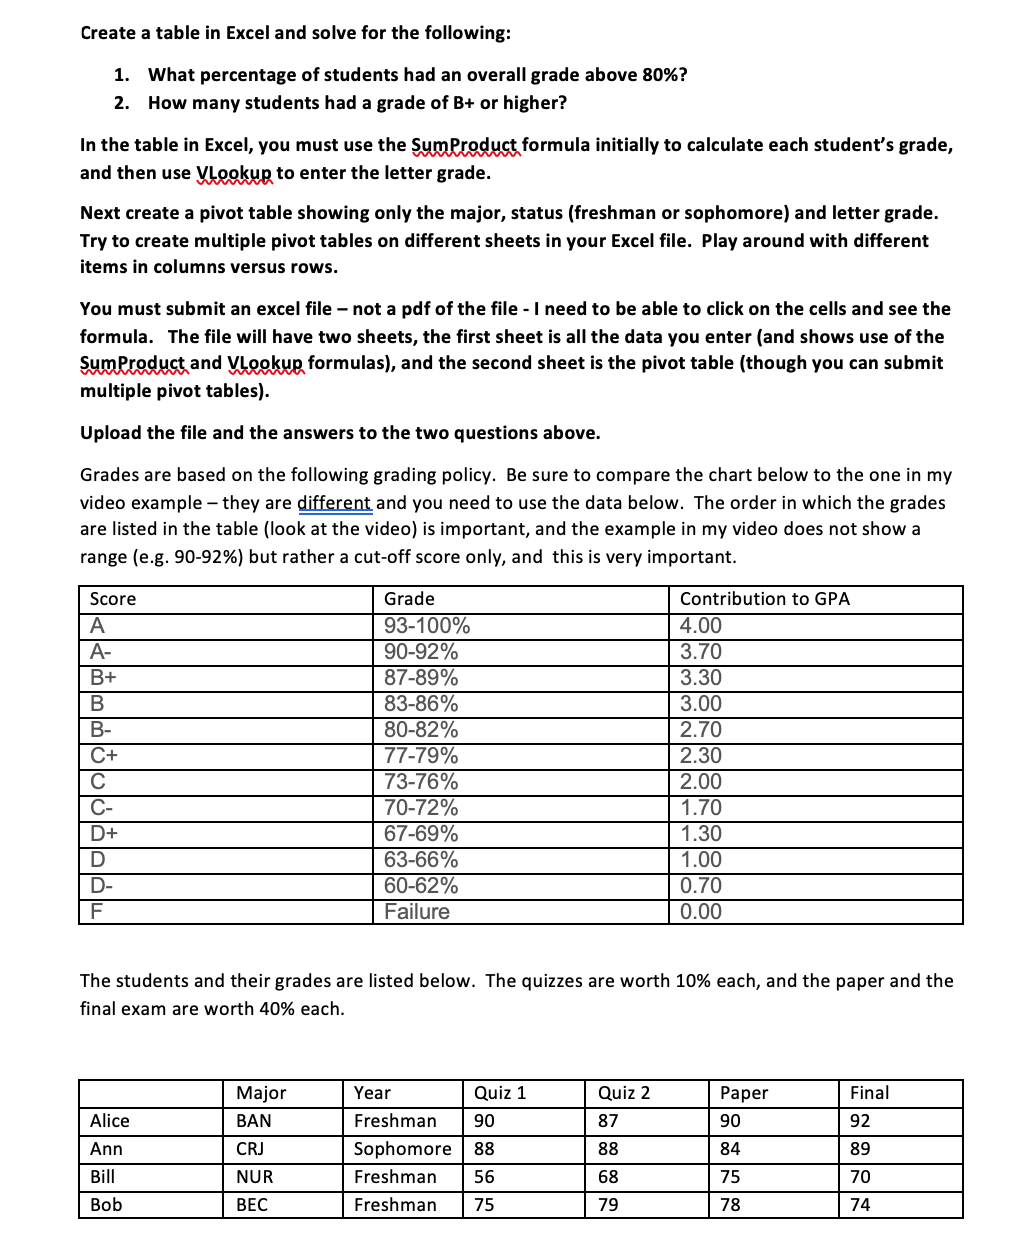
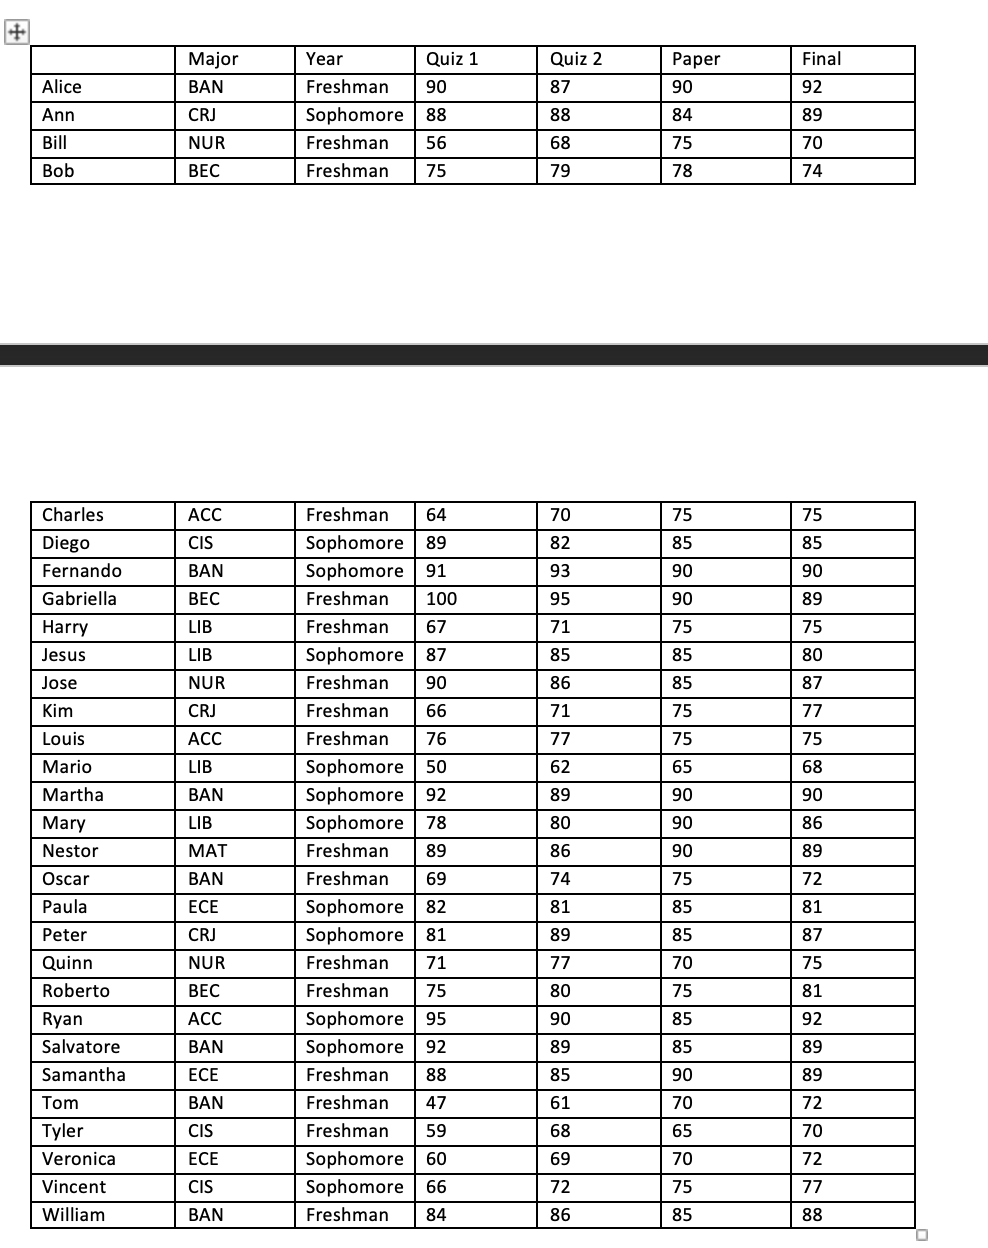
Create a table in Excel and solve for the following: 1. What percentage of students had an overall grade above 80%? 2. How many students had a grade of 5+ or higher? In the table in Excel, you must use the Wformula initially to calculate each student's grade, and then use Wm enter the letter grade. Next create a pivot table showing only the major, status (freshman or sophomore) and letter grade. Try to create multiple pivot tables on different sheets in your Excel file. Play around with different items in columns versus rows. You must submit an excel file not a pdf of the file - I need to be able to click on the cells and see the formula. The file will have two sheets, the first sheet is all the data you enter (and shows use of the Wand Wformulas), and the second sheet is the pivot table (though you can submit multiple pivot tables}. Upload the file and the answers to the two questions above. Grades are based on the following grading policy. Be sure to compare the chart below to the one in my video example they are djeLentand you need to use the data below. The order in which the grades are listed in the table {look at the video} is important, and the example in my video does not show a range {e.g. 90-92%} but rather a cut-off score only, and this is very important. _ _ _ _ _ _ _ The students and their grades are listed below. The quizzes are worth 10% each, and the paper and the nal exam are worth 40% each. mm \"WWME-E_ m_____E_E_ WWWE-m m Major Year Quiz 1 Quiz 2 Paper Final Alice BAN Freshman 90 87 90 92 Ann CRJ Sophomore 88 89 84 89 Bill NUR Freshman 56 68 75 70 Bob BEC Freshman 75 79 78 74 Charles ACC Freshman 64 70 75 75 Diego CIS Sophomore 82 85 85 Fernando BAN Sophomore 91 93 90 90 Gabriella BEC Freshman 100 95 90 89 Harry LIB Freshman 67 71 75 75 Jesus LIB Sophomore 87 85 85 80 Jose NUR Freshman 90 86 85 87 Kim CRJ Freshman 66 71 75 77 Louis ACC Freshman 76 77 75 75 Mario LIB Sophomore 50 62 65 68 Martha BAN Sophomore 92 89 90 90 Mary LIE Sophomore BL 80 90 86 Nestor MAT Freshman 89 86 90 89 Osca BAN Freshman 69 74 75 72 Paula ECE Sophomore 82 81 85 81 Peter CRJ Sophomore 81 89 85 87 Quinn NUR Freshman 71 77 70 75 Roberto BEC Freshman 75 80 75 81 Ryan ACC Sophomore 95 90 85 92 Salvatore BAN Sophomore 92 89 85 39 Samantha ECE Freshman 88 85 90 89 Tom BAN Freshman 47 61 70 72 Tyler CIS Freshman 59 68 65 70 Veronica ECE Sophomore 60 69 70 72 Vincent CIS Sophomore 66 72 75 77 William BAN Freshman 84 86 85 88
Step by Step Solution
There are 3 Steps involved in it

Get step-by-step solutions from verified subject matter experts