

Question: Please attach an excel spreadsheet reflecting the following forecast in a graphical data such as a bar graph etc.. OOO AutoSave OFF ... Forecast 1
Please attach an excel spreadsheet reflecting the following forecast in a graphical data such as a bar graph etc..
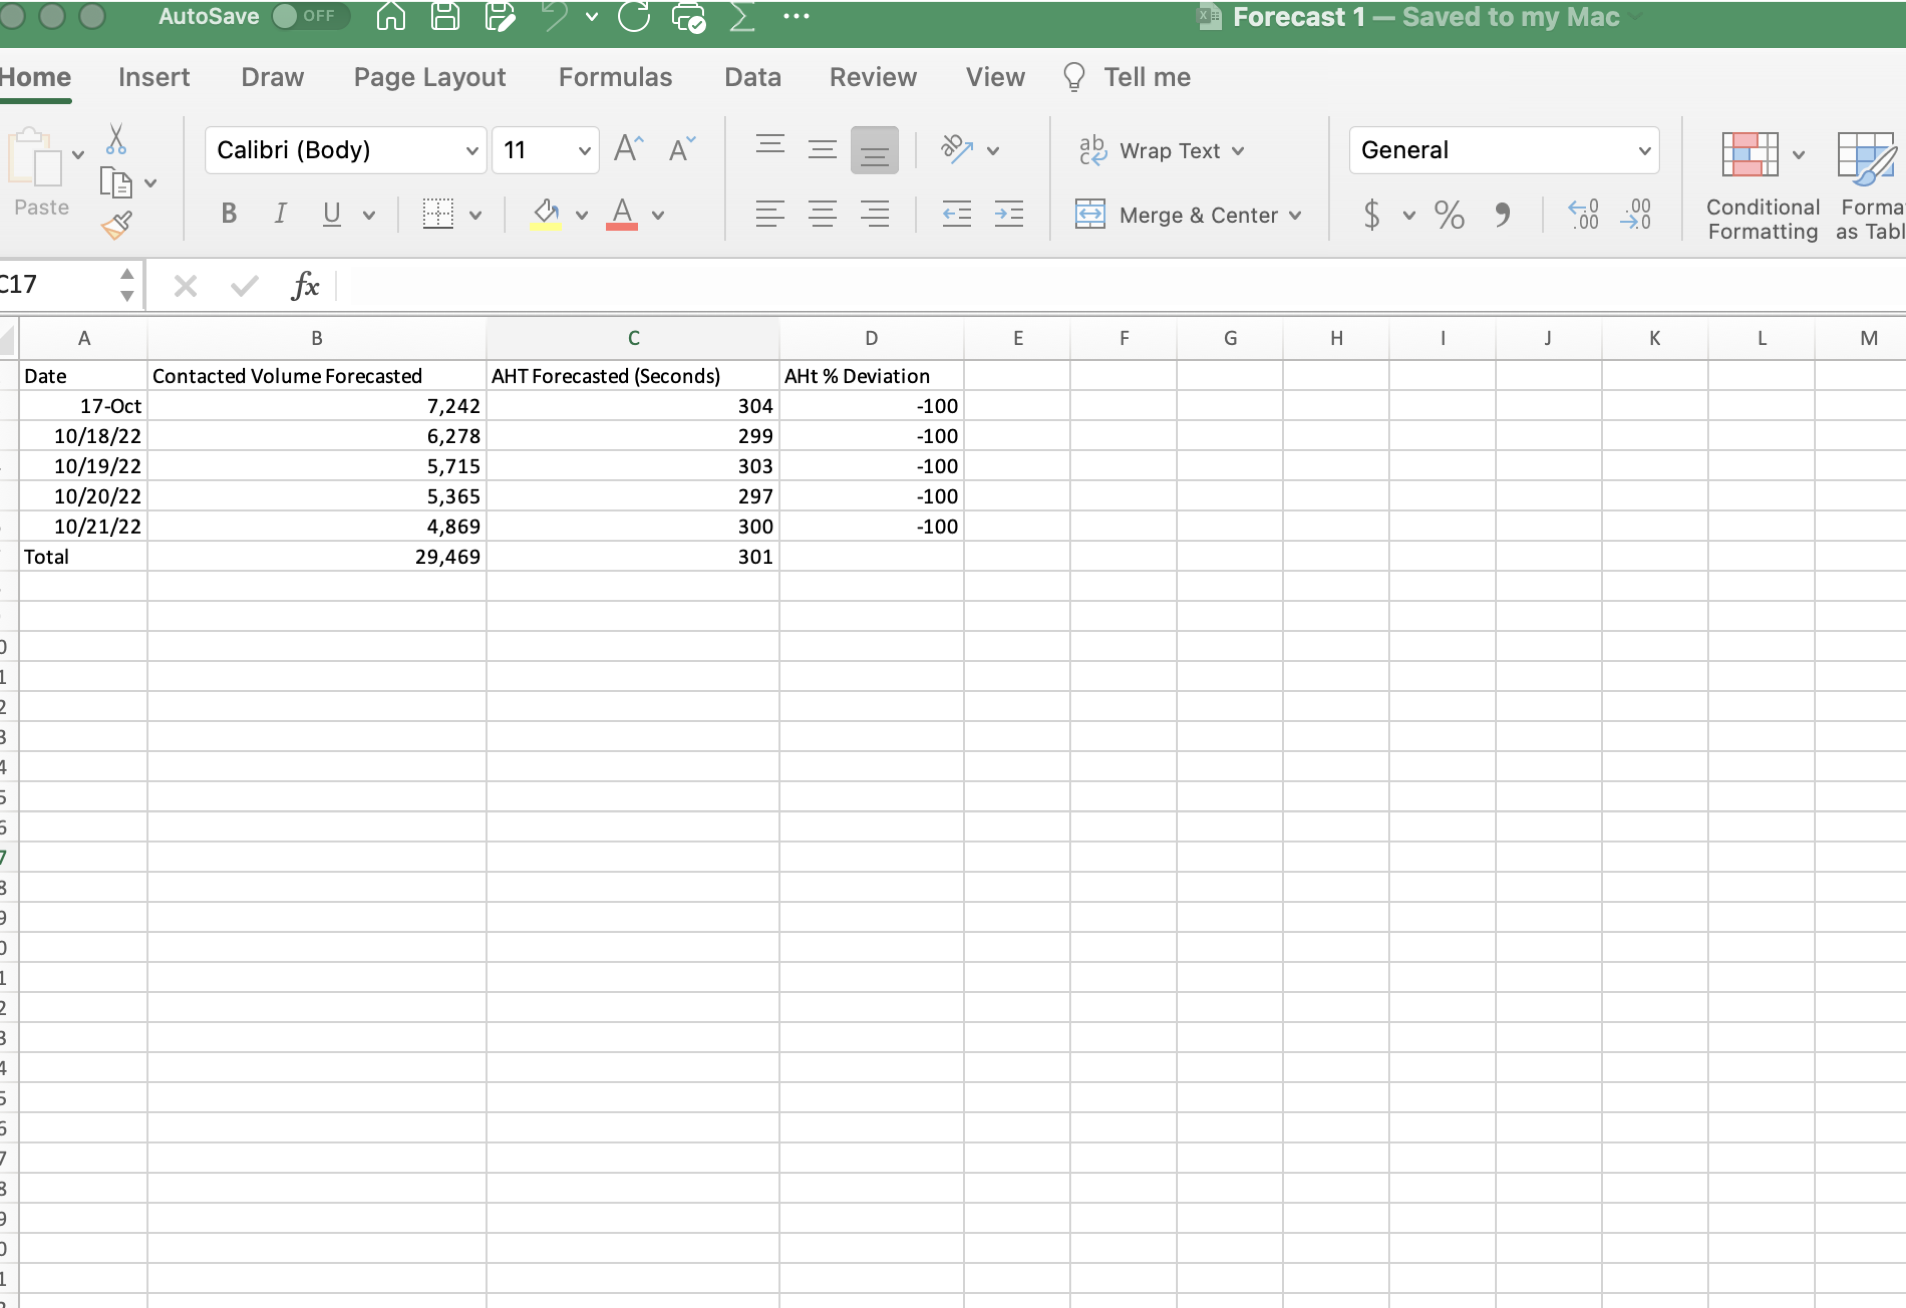
OOO AutoSave OFF ... Forecast 1 - Saved to my Mac Home Insert Draw Page Layout Formulas Data Review View ? Tell me Calibri (Body) 11 AA ab Wrap Text v General Paste BI U MvAv E Merge & Center v $ ~ % 9 .00 Conditional Forma Formatting as Tab 17 X V fx A B C D E F G H I J K L M Date Contacted Volume Forecasted AHT Forecasted (Seconds) AHt % Deviation 17-Oct 7,242 304 -100 10/18/22 6,278 299 -100 10/19/22 5,715 303 -100 10/20/22 5,365 297 -100 10/21/22 4,869 300 -100 Total 29,469 301
Step by Step Solution
There are 3 Steps involved in it
1 Expert Approved Answer
Step: 1 Unlock

Question Has Been Solved by an Expert!
Get step-by-step solutions from verified subject matter experts
Step: 2 Unlock
Step: 3 Unlock