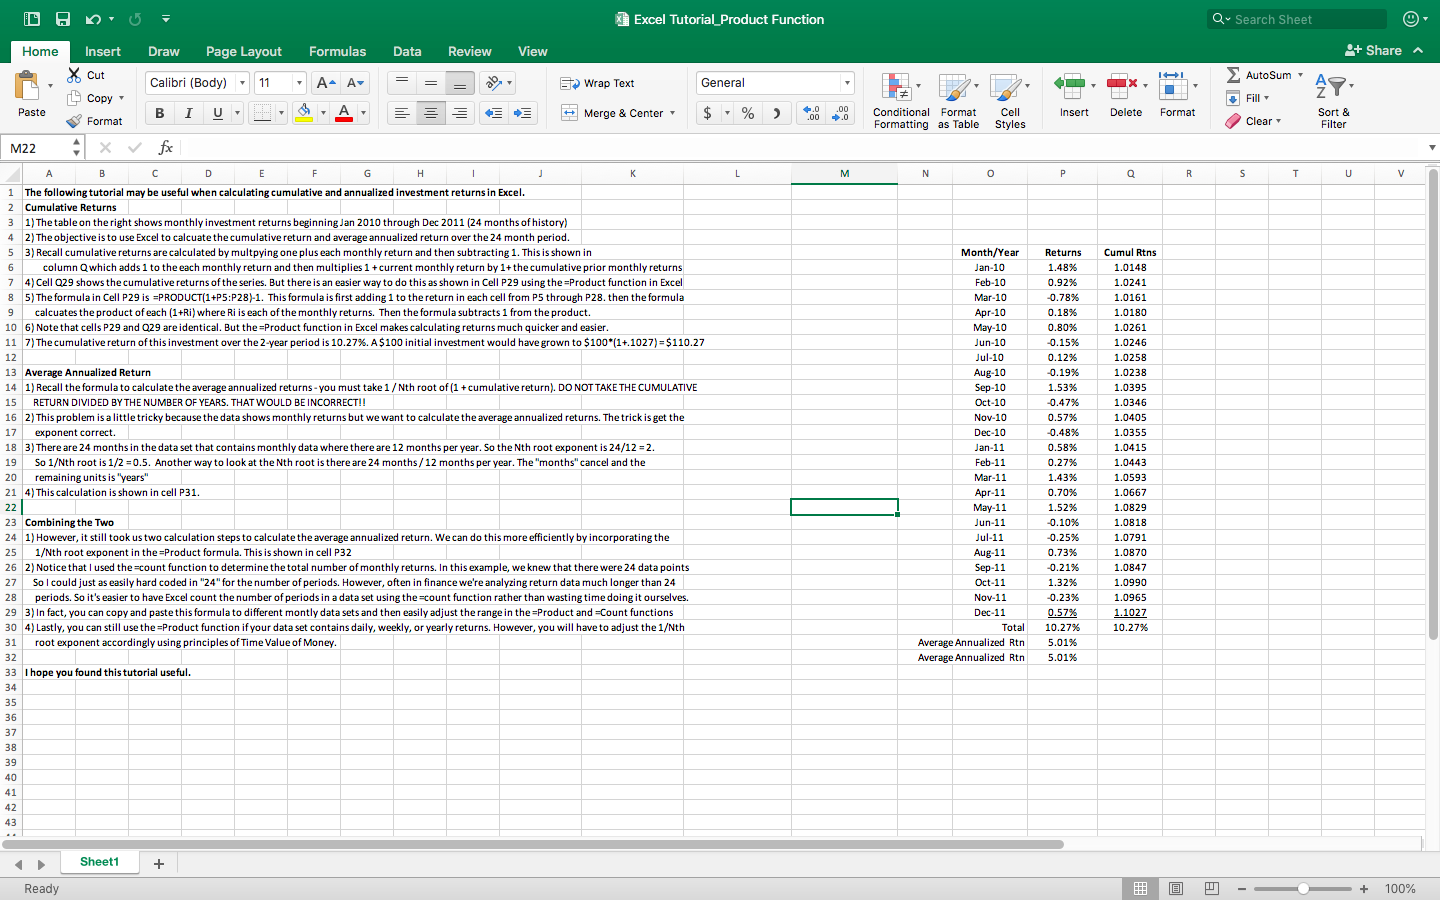
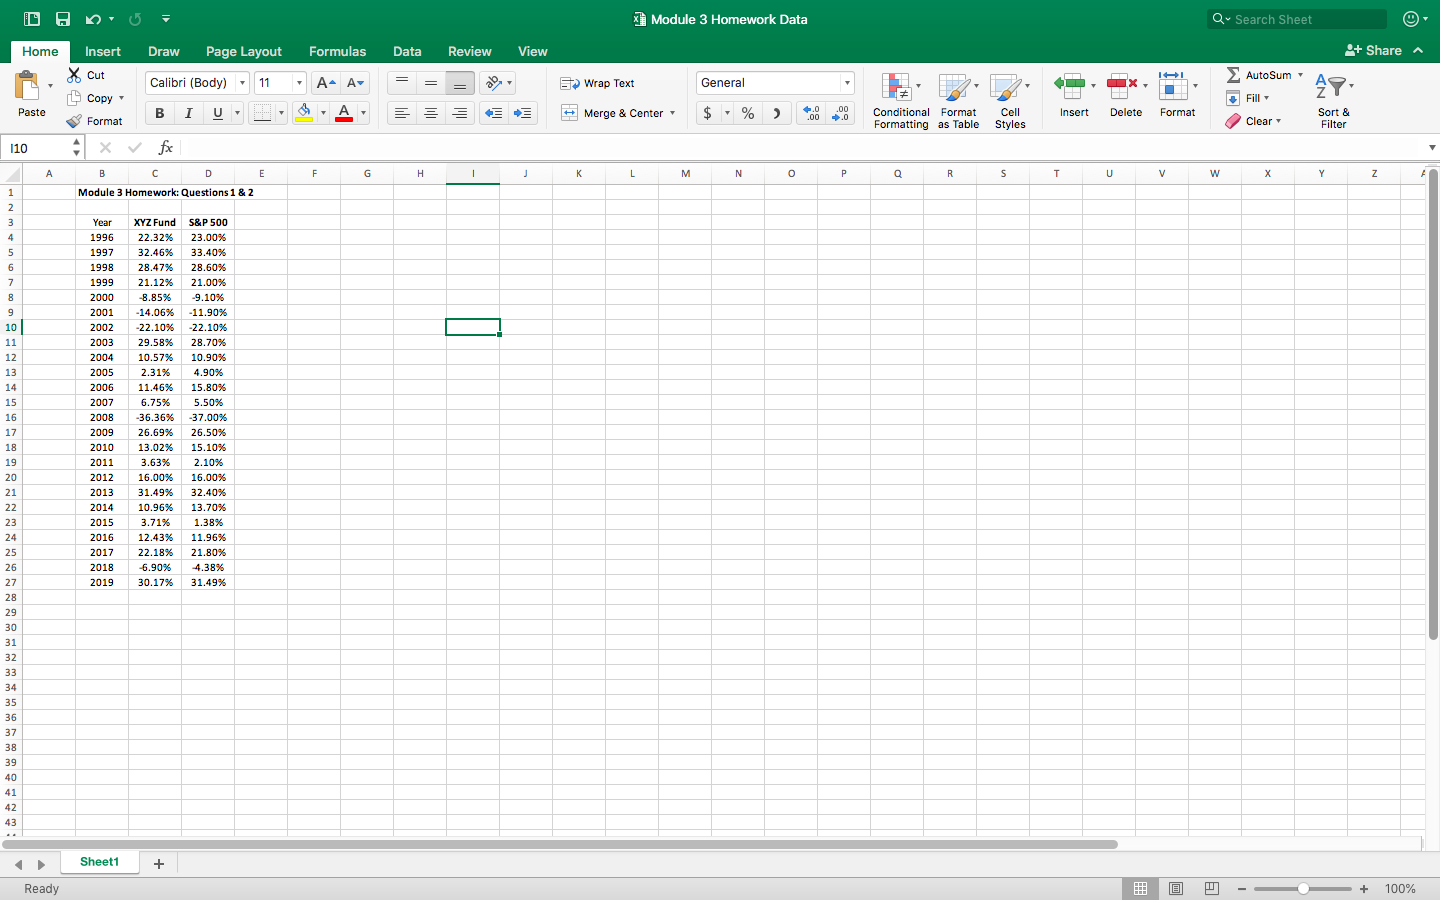
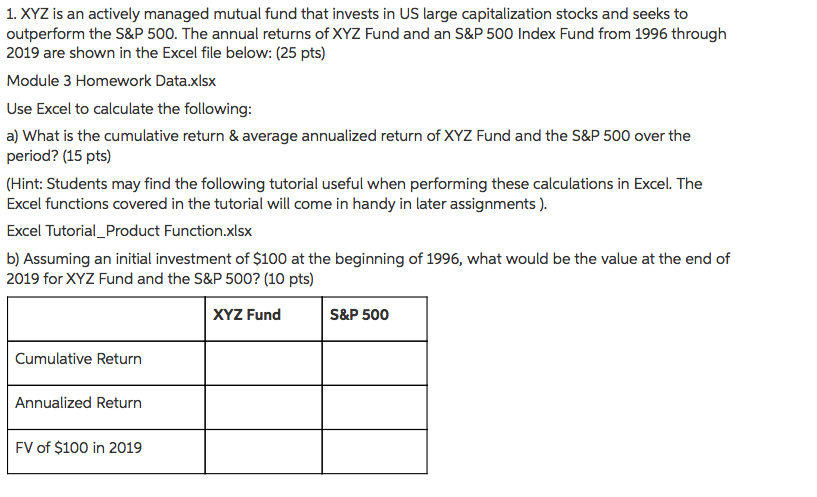
Question: Please attach excel file with work !! Excel Tutorial_Product Function Q ~ Search Sheet Home Insert Draw Page Layout Formulas Data Review View + Share

Please attach excel file with work !!

Please attach excel file with work !! ExcelPlease attach excel file with work !! ExcelPlease attach excel file with work !! Excel
Excel Tutorial_Product Function Q ~ Search Sheet Home Insert Draw Page Layout Formulas Data Review View + Share X Cut Calibri (Body) * 11 A- A Wrap Text General 2 AutoSum Copy Fill Paste BI UTY MA Merge & Center $ % 2 00 $.0 Conditional Format Cell Insert Delete Format Clear Sort & Format Formatting as Table Styles Filter M22 X v fx B C E F G H K L M N 0 P Q R S T U The following tutorial may be useful when calculating cumulative and annualized investment returns in Excel. Cumulative Returns 1) The table on the right shows monthly investment returns beginning Jan 2010 through Dec 2011 (24 months of history) 2) The objective is to use Excel to calcuate the cumulative return and average annualized return over the 24 month period. 5 3) Recall cumulative returns are calculated by multpying one plus each monthly return and then subtracting 1. This is shown in Month/Year Returns Cumul Atms 6 column Qwhich adds 1 to the each monthly return and then multiplies 1 + current monthly return by 1+ the cumulative prior monthly returns an-10 1.48% 1.0148 7 4) Cell Q29 shows the cumulative returns of the series. But there is an easier way to do this as shown in Cell P29 using the =Product function in Excel Feb-10 0.92% 1.024 p Co 5) The formula in Cell P29 is =PRODUCT(1+P5:P28)-1. This formula is first adding 1 to the return in each cell from PS through P28. then the formula Mar-10 0.78% 1.0161 calcuates the product of each (1+Ri) where Ri is each of the monthly returns. Then the formula subtracts 1 from the product. Apr-10 0.18% 1.0180 10 6) Note that cells P29 and Q29 are identical. But the=Product function in Excel makes calculating returns much quicker and easier. May-10 0.80%% 1.0261 11 7) The cumulative return of this investment over the 2-year period is 10.27%. A $100 initial investment would have grown to $100*(1+.1027) = $110.27 Jun-10 0.15% 1.0246 12 Jul-10 0.12% 1.025 3 Average Annualized Return Aug-10 0.19% 1.023 14 1) Recall the formula to calculate the average annualized returns - you must take 1 / Nth root of (1 + cumulative return). DO NOT TAKE THE CUMULATIVE Sep-10 1.53% 1.0395 15 RETURN DIVIDED BY THE NUMBER OF YEARS. THAT WOULD BE INCORRECT!! Oct-10 -0.47% 1.0346 16 2) This problem is a little tricky because the data shows monthly returns but we want to calculate the average annualized returns. The trick is get the Nov-10 0.57% 1.0405 17 exponent correct. Dec-10 0.48% 1.035 8 3) There are 24 months in the data set that contains monthly data where there are 12 months per year. So the Nth root exponent is 24/12 = 2. an-11 0.58%% 1.0415 19 So 1/Nth root is 1/2 =0.5. Another way to look at the Nth root is there are 24 months/ 12 months per year. The "months" cancel and the Feb-11 0.27% 1.0443 20 remaining units is "years" Mar-11 1.43% 1.0593 21 4) This calculation is shown in cell P31. Apr-11 0.70% 1.0667 22 May-1 1.52% 1.082 23 Combining the Two Jun-11 0.10% 1.0818 24 1) However, it still took us two calculation steps to calculate the average annualized return. We can do this more efficiently by incorporating the Jul-1 0.25%% 1.079 25 1/Nth root exponent in the=Product formula. This is shown in cell P32 Aug-11 0.73% 1.0870 26 2) Notice that I used the =count function to determine the total number of monthly returns. In this example, we knew that there were 24 data points Sep-11 0.21% 1.0847 27 So I could just as easily hard coded in "24" for the number of periods. However, often in finance we're analyzing return data much longer than 24 Oct-11 1.32 1.099 28 periods. So it's easier to have Excel count the number of periods in a data set using the =count function rather than wasting time doing it ourselves. Nov-11 0.23% 1.0965 29 3) In fact, you can copy and paste this formula to different montly data sets and then easily adjust the range in the=Product and =Count functions Dec-11 0.57% 1.102 4) Lastly, you can still use the =Product function if your data set contains daily, weekly, or yearly returns. However, you will have to adjust the 1/Nth Total 10.27% 10.27% 31 root exponent accordingly using principles of Time Value of Money. Average Annualized Rtn 5.01% 32 Average Annualized Rtn 5.01% 3 I hope you found this tutorial useful. 34 35 36 37 38 39 40 Sheet1 + Ready - + 100%Module 3 Homework Data Q ~ Search Sheet + Share Home Insert Draw Page Layout Formulas Data Review View 2 AutoSum X Cut Calibri (Body) * 11 A- A Wrap Text General Fill Copy |Merge & Center $ ~ % 2 60 .0 Conditional Format Cell Insert Delete Format Formatting as Table Styles Clear Sort & Filter Paste Format 110 X V fx F G H J K L M N 0 P Q R S T U V W X Z A E Module 3 Homework: Questions 1 & 2 Year XYZ Fund S&P 500 1996 22.32% 23.00% 1997 32.46% 33.40% 1998 28.47% 28.60% D CO 1999 21.12% 21.00% 2000 -8.85% -9.10% 2001 -14.06% -11.90% 2002 -22.10% -22.10 2003 29.58% 28.70% 2004 10.57% 10.90% 2005 2.31% 4.90% 2006 11.46% 15.80% 2007 6.75% 5.50% 2008 36.36% -37.00% 2009 26.69% 26.50% 2010 13.02% 15.10% 2011 3.63% 2.10%% 2012 16.00% 16.00% 2013 31.49% 32.40% 2014 10.96% 13.70% 2015 3.71% 1.38% 2016 12.43% 11.96% 2017 22.18% 21.80% 2018 -6.90% 4.38% 2019 30.17% 31.49% Sheet1 + - + 100% Ready1. XYZ is an actively managed mutual fund that invests in US large capitalization stocks and seeks to outperform the S&P 500. The annual returns of XYZ Fund and an S&P 500 Index Fund from 1996 through 2019 are shown in the Excel file below: (25 pts) Module 3 Homework Data.xlsx Use Excel to calculate the following: a) What is the cumulative return & average annualized return of XYZ Fund and the S&P 500 over the period? (15 pts) (Hint: Students may find the following tutorial useful when performing these calculations in Excel. The Excel functions covered in the tutorial will come in handy in later assignments ). Excel Tutorial_Product Function.xlsx b) Assuming an initial investment of $100 at the beginning of 1996, what would be the value at the end of 2019 for XYZ Fund and the S&P 500? (10 pts) XYZ Fund S&P 500 Cumulative Return Annualized Return FV of $100 in 2019

Step by Step Solution

There are 3 Steps involved in it

1 Expert Approved Answer
Step: 1 Unlock blur-text-image
Question Has Been Solved by an Expert!

Get step-by-step solutions from verified subject matter experts

Step: 2 Unlock
Step: 3 Unlock

Students Have Also Explored These Related Finance Questions!