

Question: Please attach w solution PER CAPITA OUTPUT YEAR In the Romer model in the figure above, at time to, a change in the growth rate
Please attach w solution
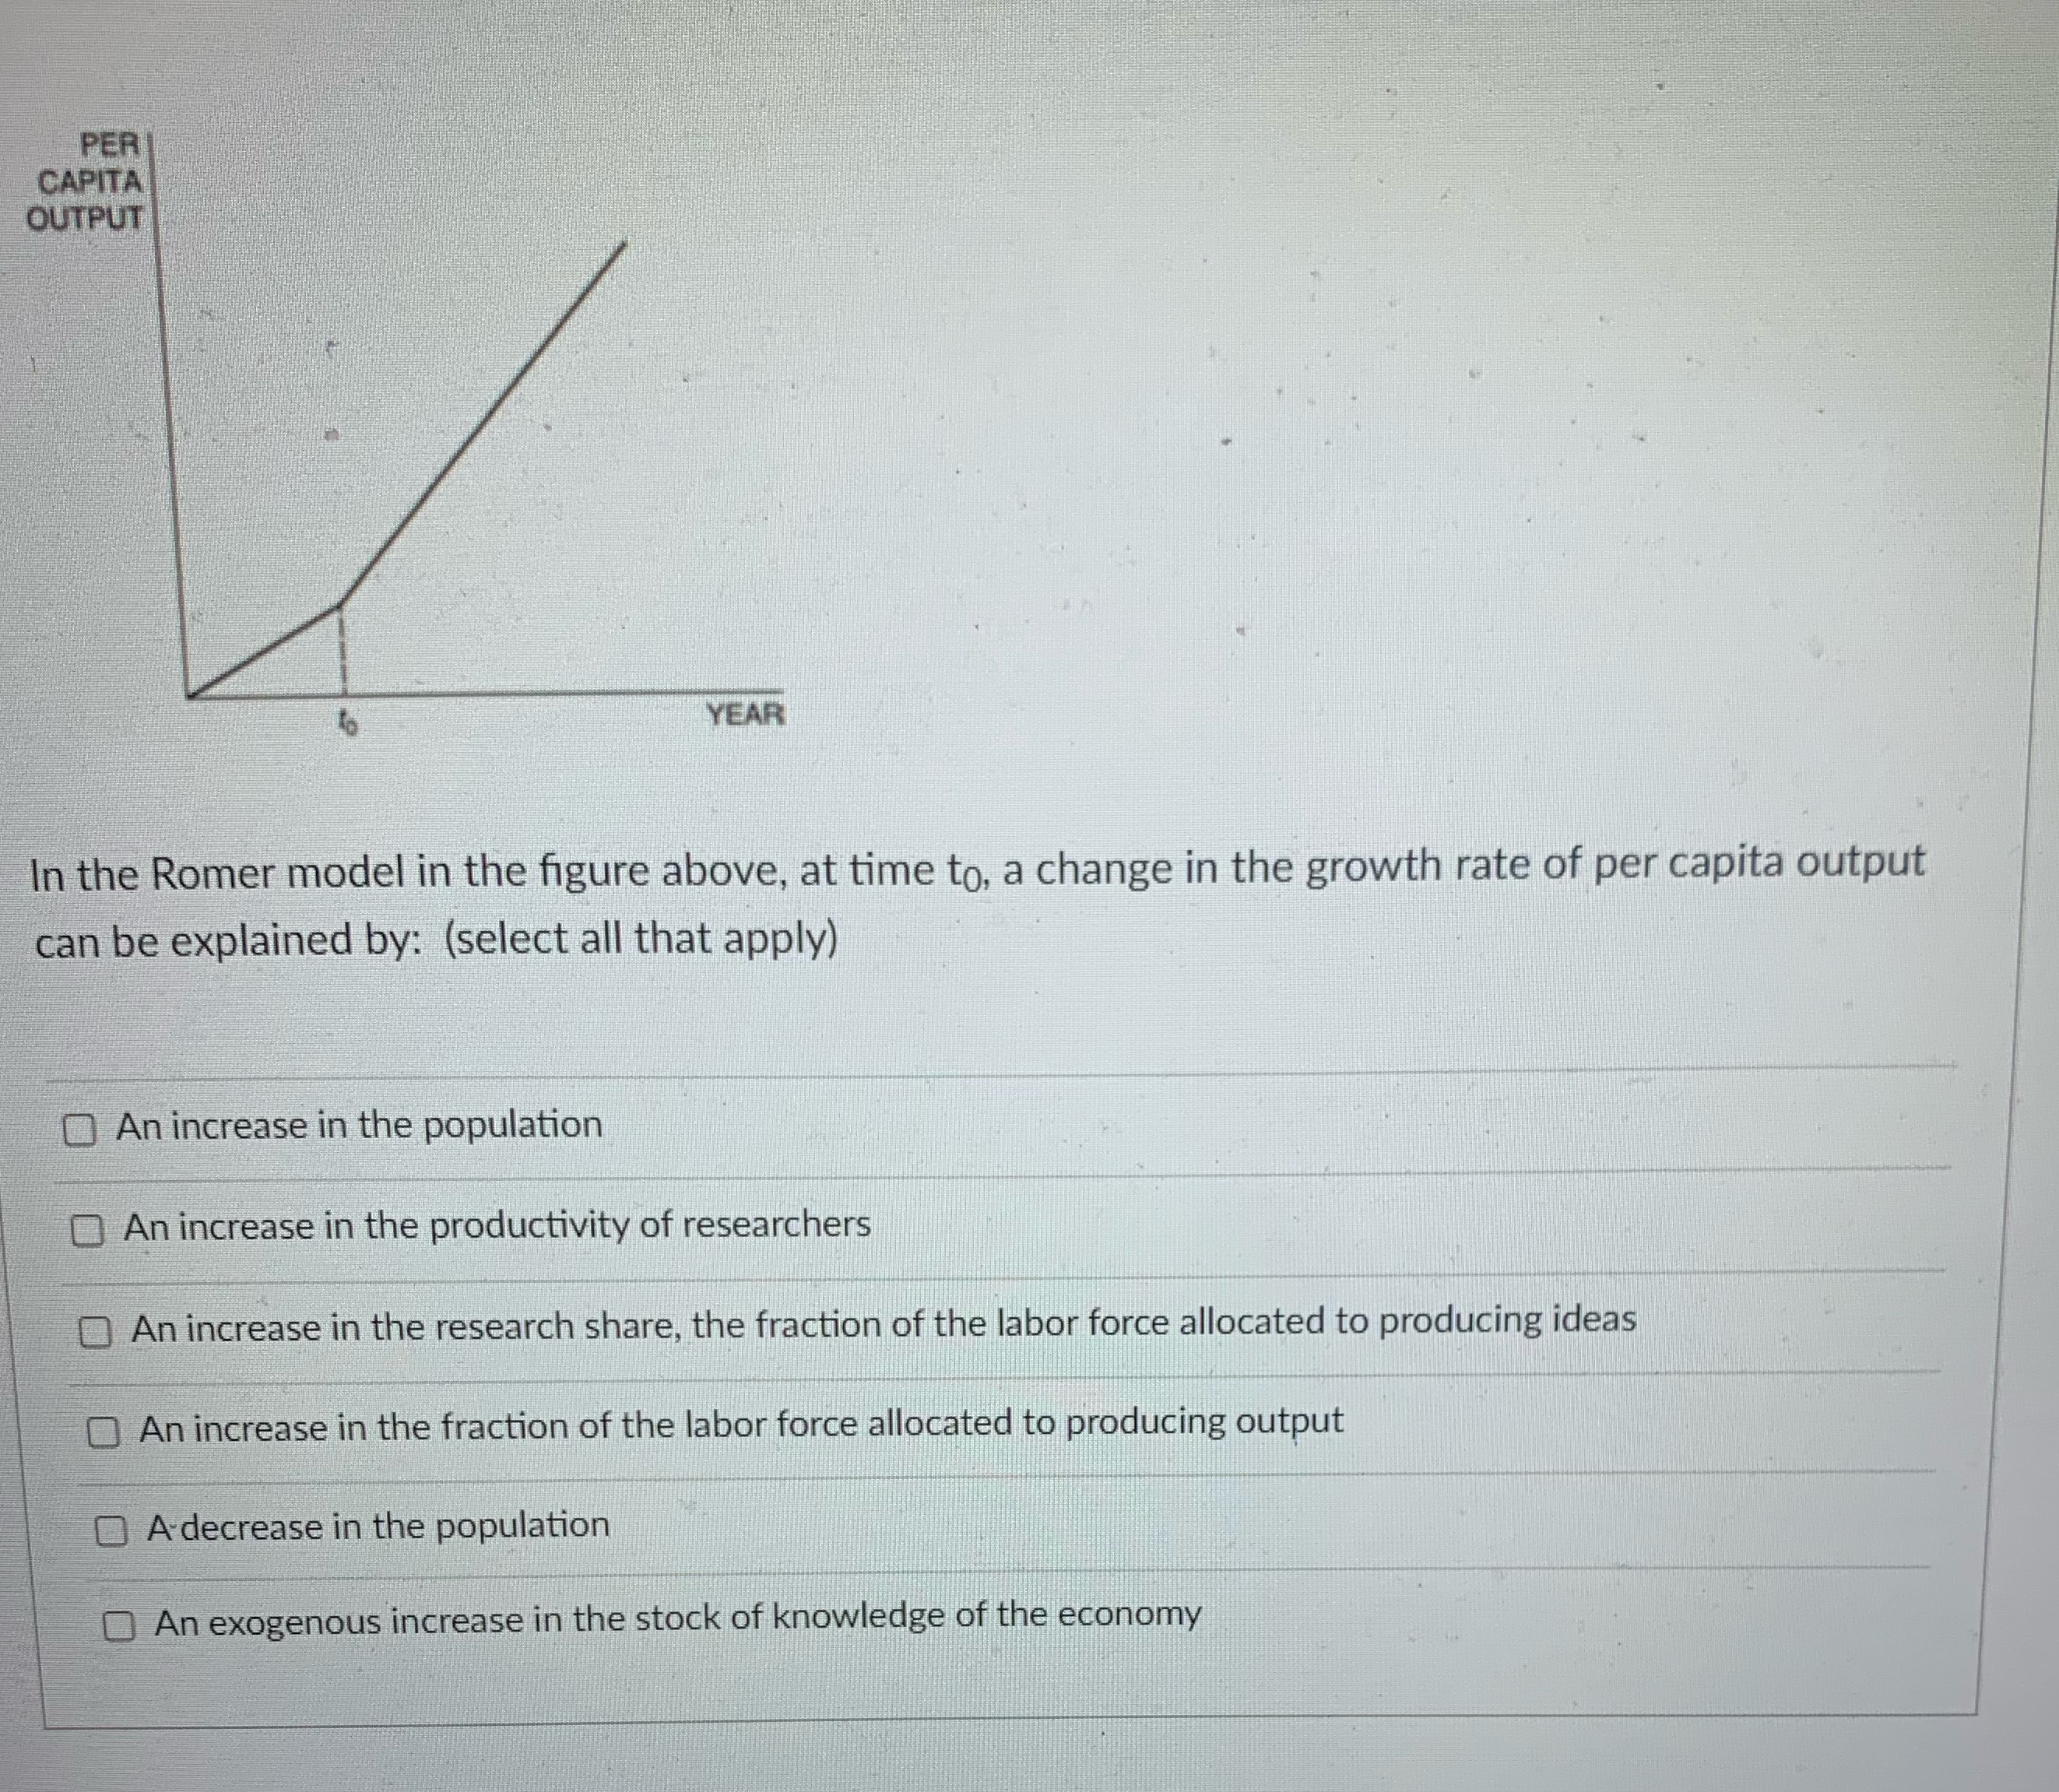
PER CAPITA OUTPUT YEAR In the Romer model in the figure above, at time to, a change in the growth rate of per capita output can be explained by: (select all that apply) An increase in the population O An increase in the productivity of researchers An increase in the research share, the fraction of the labor force allocated to producing ideas O An increase in the fraction of the labor force allocated to producing output A decrease in the population An exogenous increase in the stock of knowledge of the economy
Step by Step Solution
There are 3 Steps involved in it
1 Expert Approved Answer
Step: 1 Unlock

Question Has Been Solved by an Expert!
Get step-by-step solutions from verified subject matter experts
Step: 2 Unlock
Step: 3 Unlock