

Question: PLEASE ATTACHED THE EXCEL SHEET ONCE DONE AND Answer all Highlighted questions. Thank you! Excel Project 1- Write a short introduction to the topic. 2-
PLEASE ATTACHED THE EXCEL SHEET ONCE DONE
AND
Answer all Highlighted questions. Thank you!
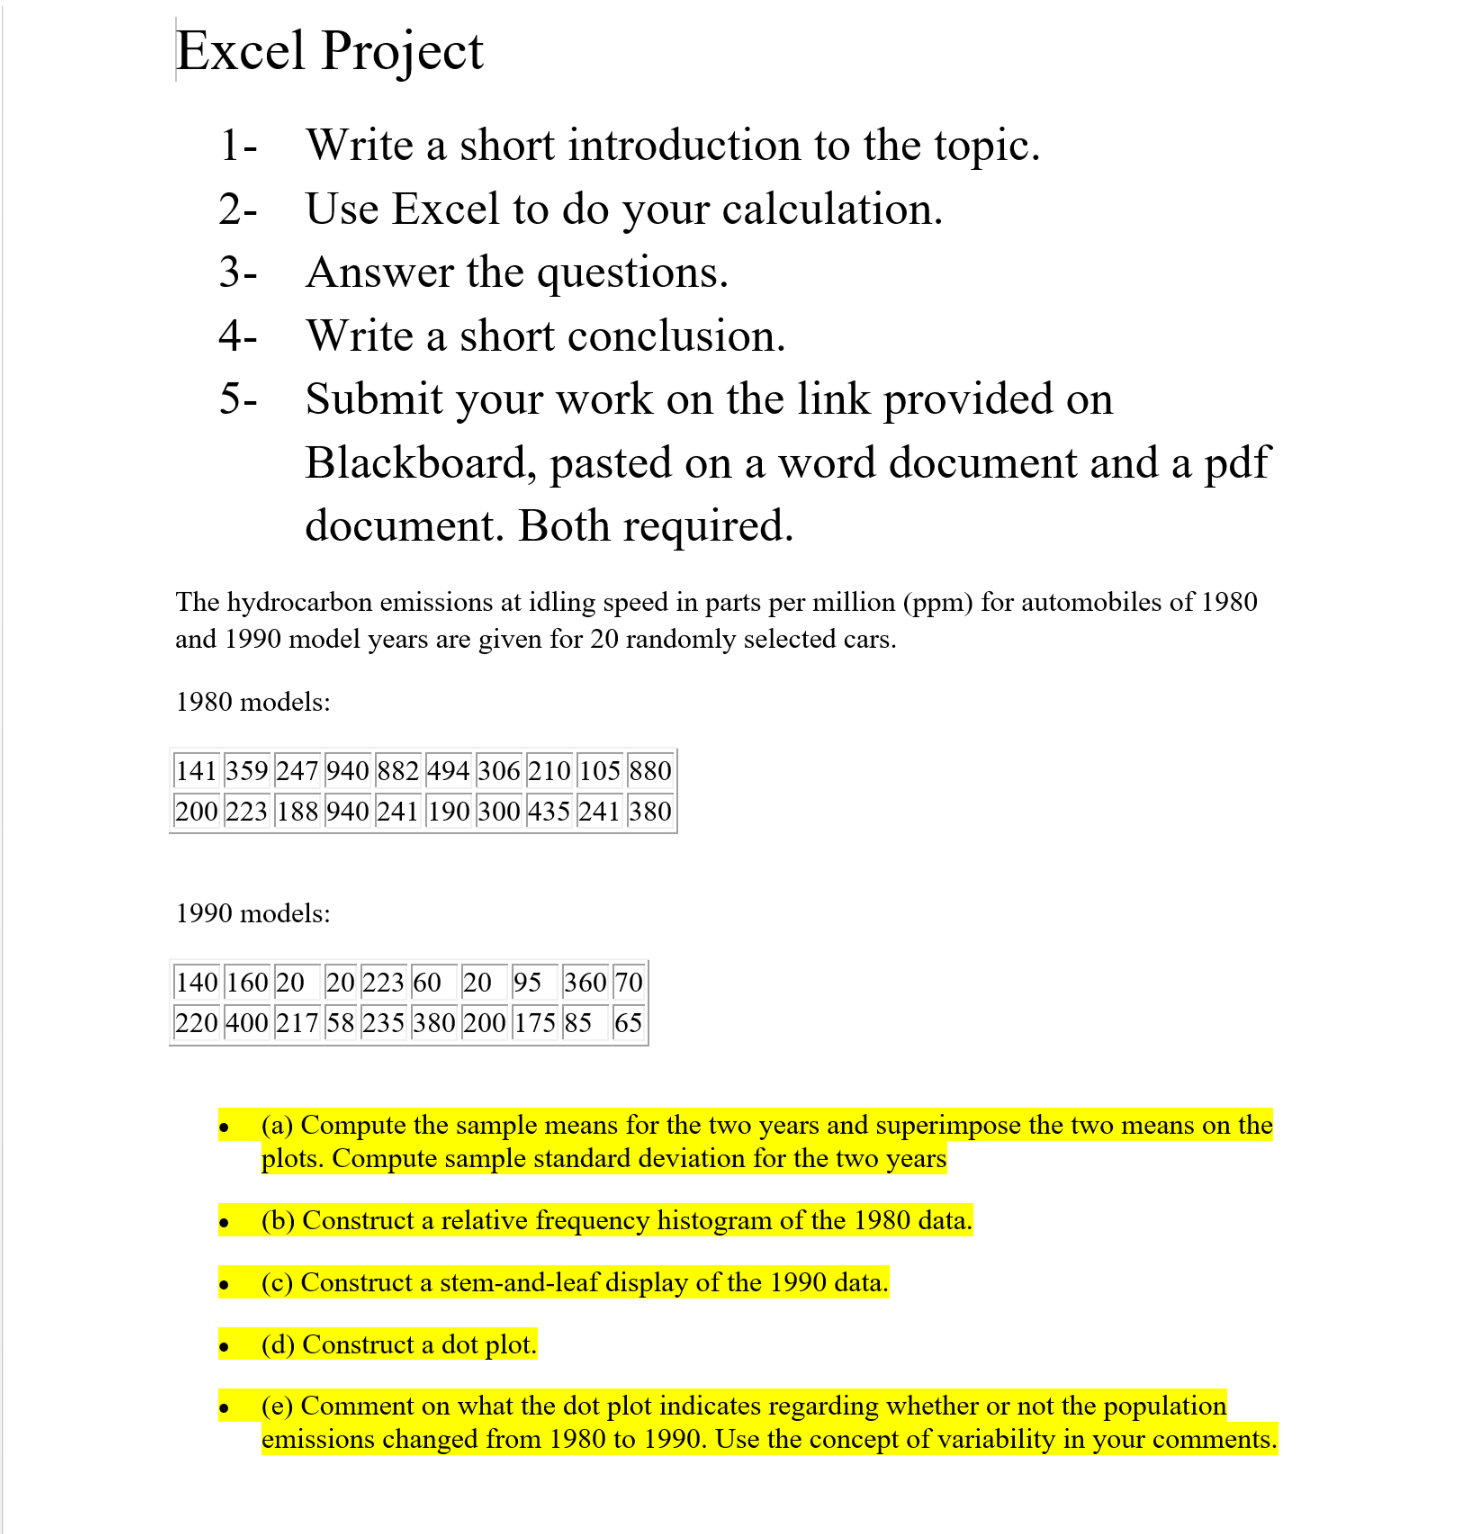
Excel Project 1- Write a short introduction to the topic. 2- Use Excel to do your calculation. 3- Answer the questions. 4- Write a short conclusion. 5- Submit your work on the link provided on Blackboard, pasted on a word document and a pdf document. Both required. The hydrocarbon emissions at idling speed in parts per million (ppm) for automobiles of 1980 and 1990 model years are given for 20 randomly selected cars. 1980 models: WWWWWWWI I200 I223 I188 I940 I241 I190 I300 I435 I241 I380 I 1990 models: I140Il60|20 I20 I223 I60 I20 I95 I360I70 EWWEIEWWWEE . (a) Compute the sample means for the two years and superimpose the two means on the plots. Compute sample standard deviation for the two years 0 (b) Construct a relative frequency histogram of the 1980 data. 0 (c) Construct a stem-andleaf display of the 1990 data. 0 (d) Construct a dot plot. 0 (e) Comment on what the dot plot indicates regarding whether or not the population emissions changed from 1980 to 1990. Use the concept of variability in your comments
Step by Step Solution
There are 3 Steps involved in it

Get step-by-step solutions from verified subject matter experts