Question: Please Be organized no need to show work Part one ? X 2.2_2.3_190_classw... . . . webassign.net Your last submission is used for your score.
Please Be organized no need to show work
Part one ?
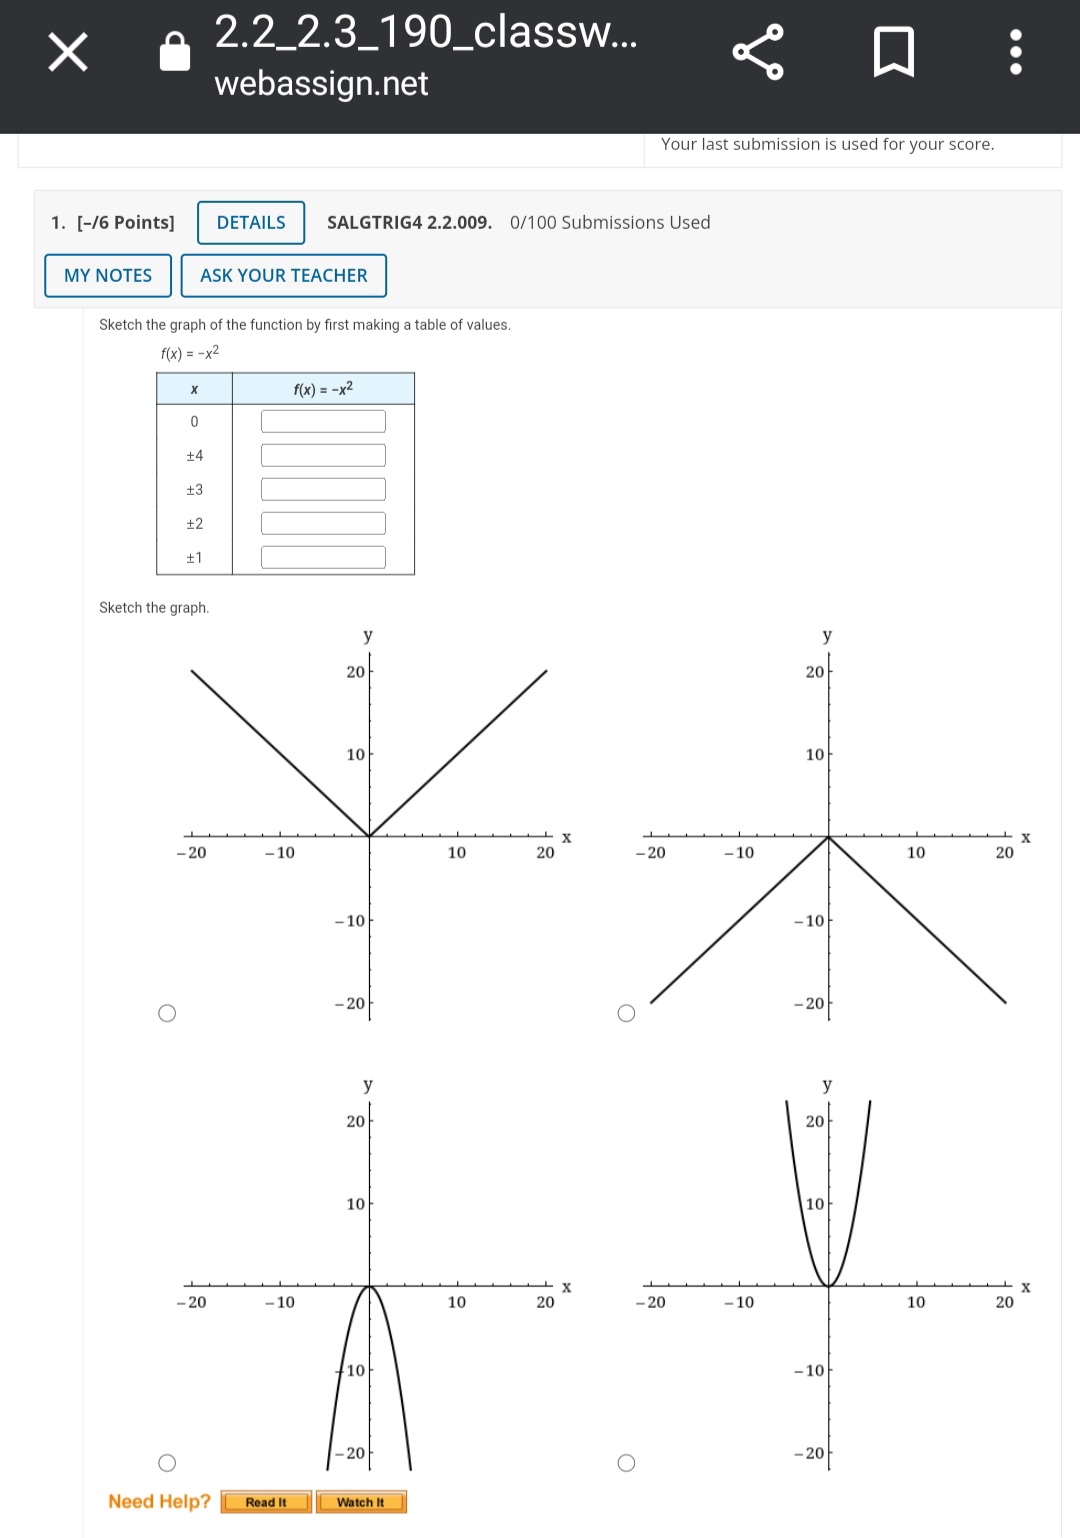
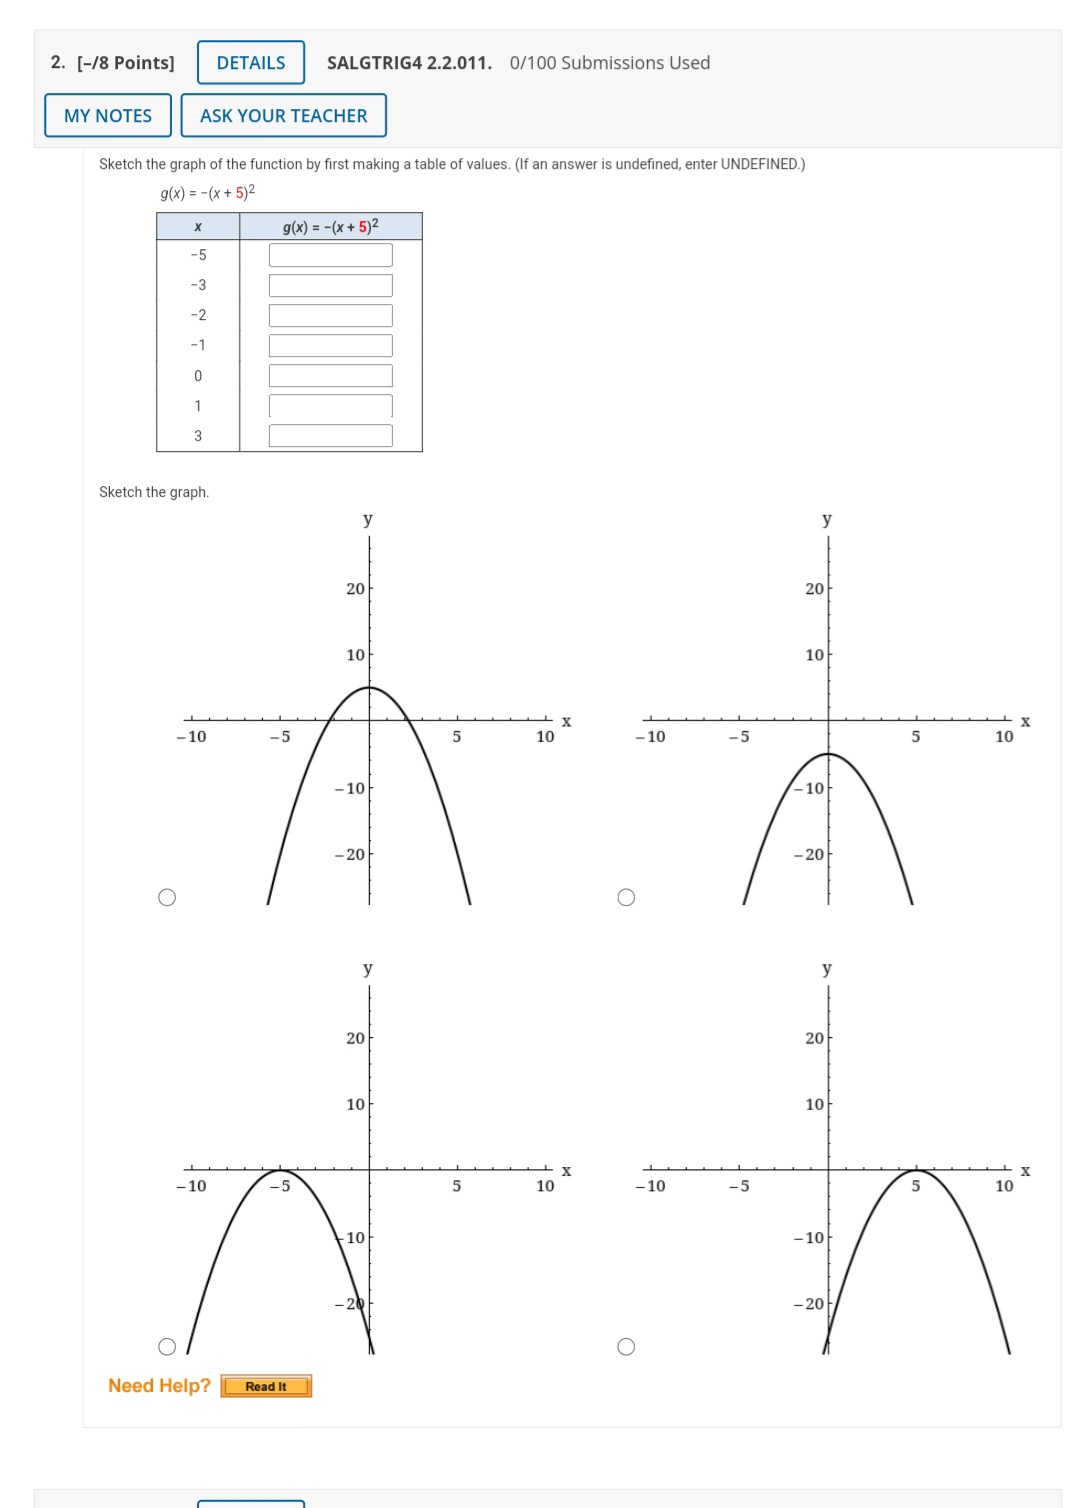
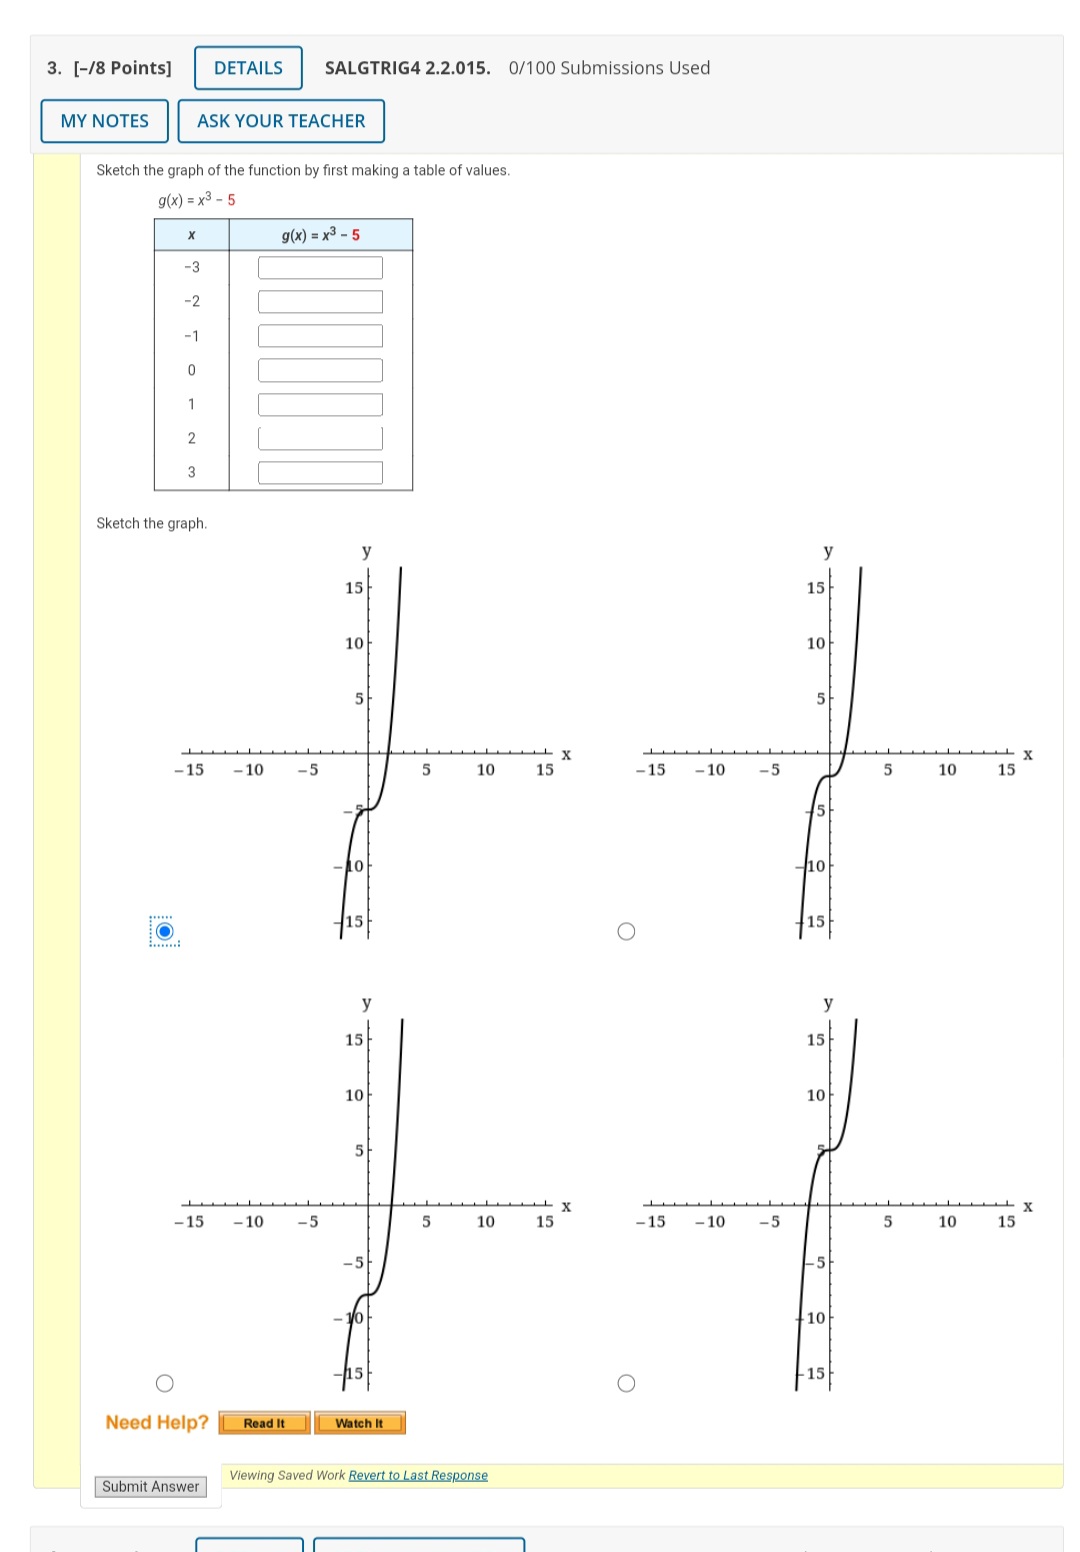
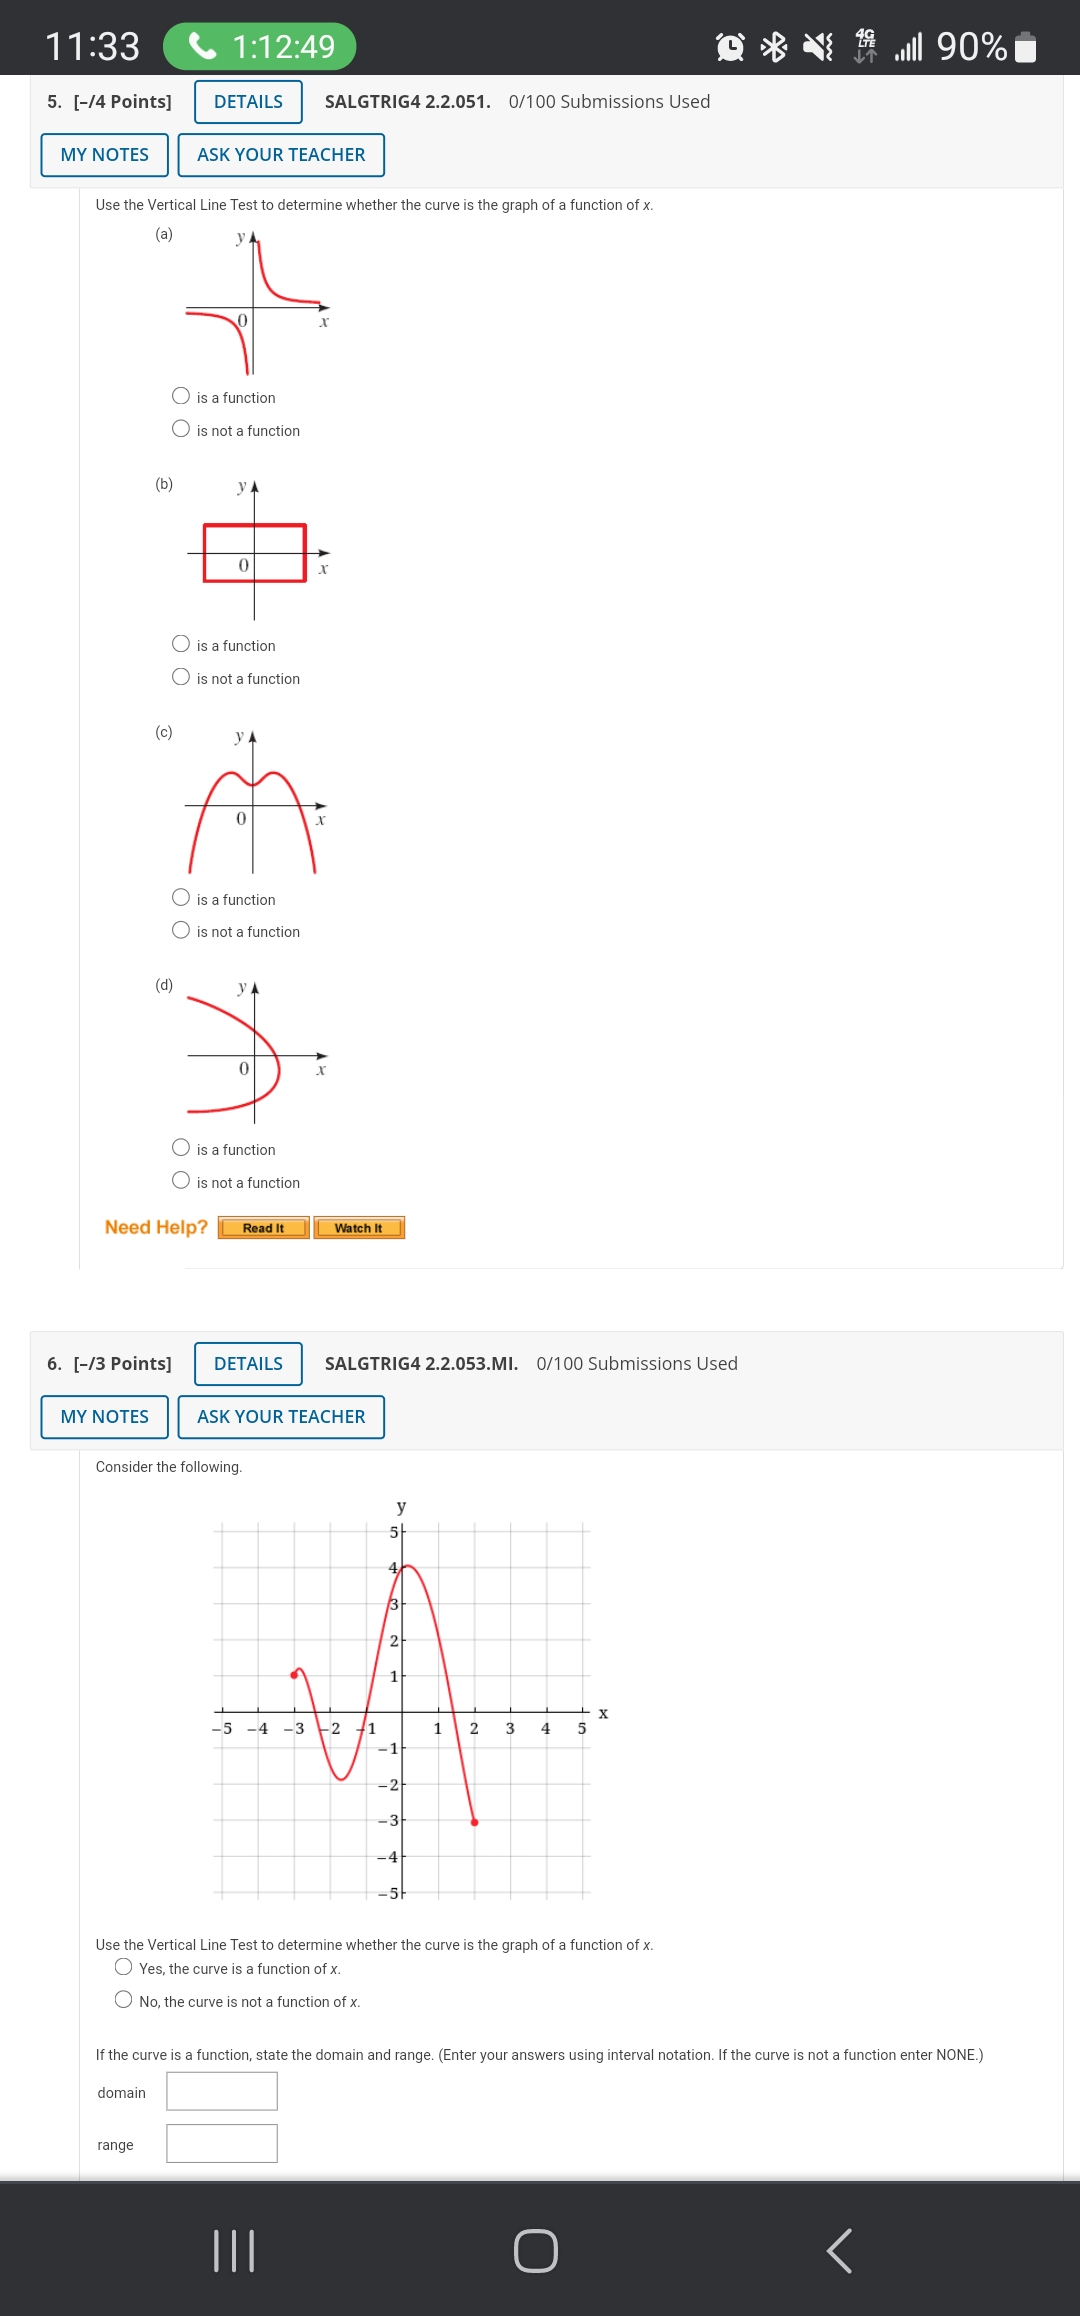
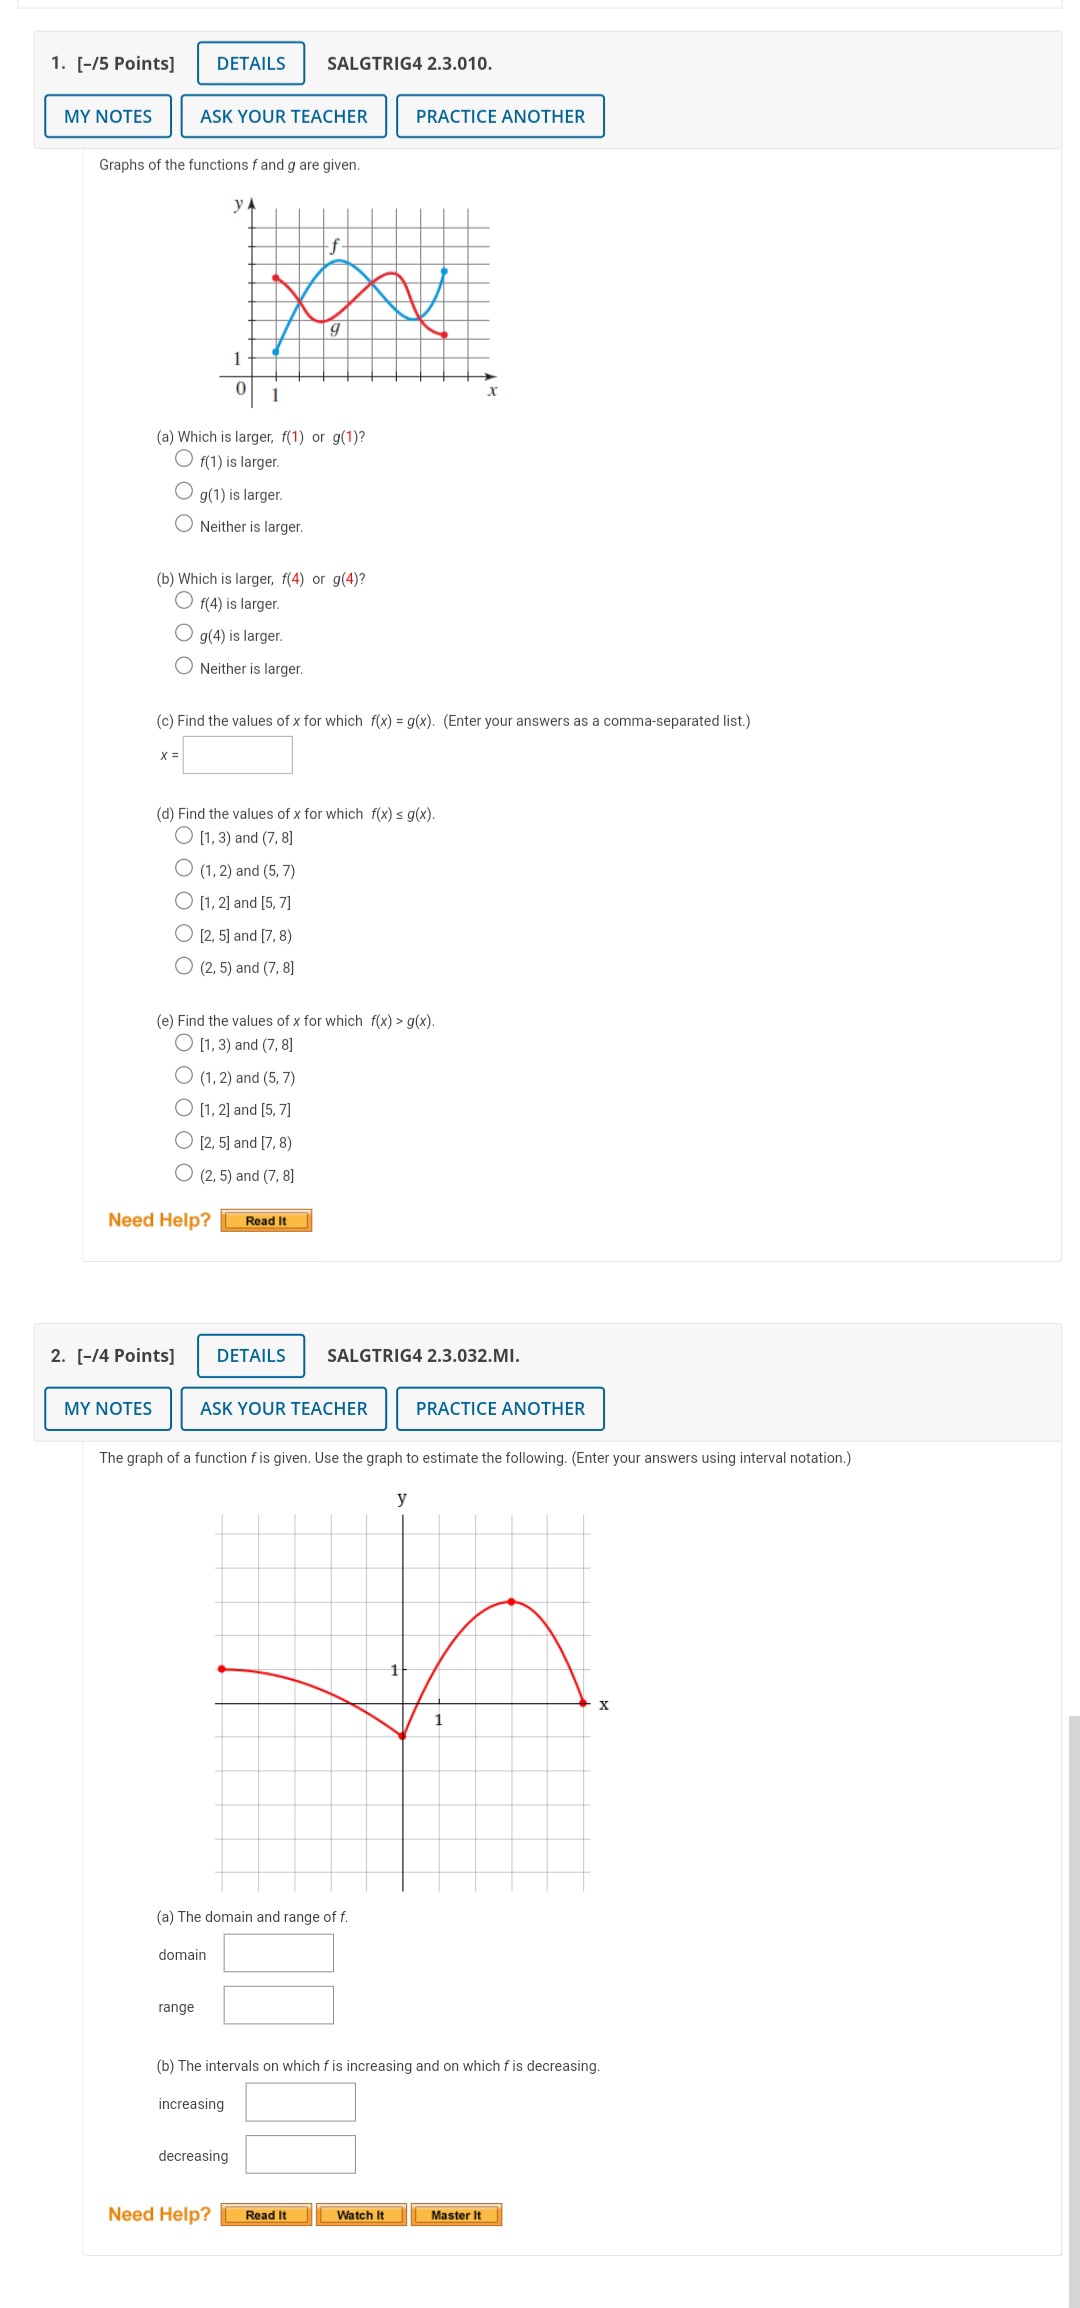
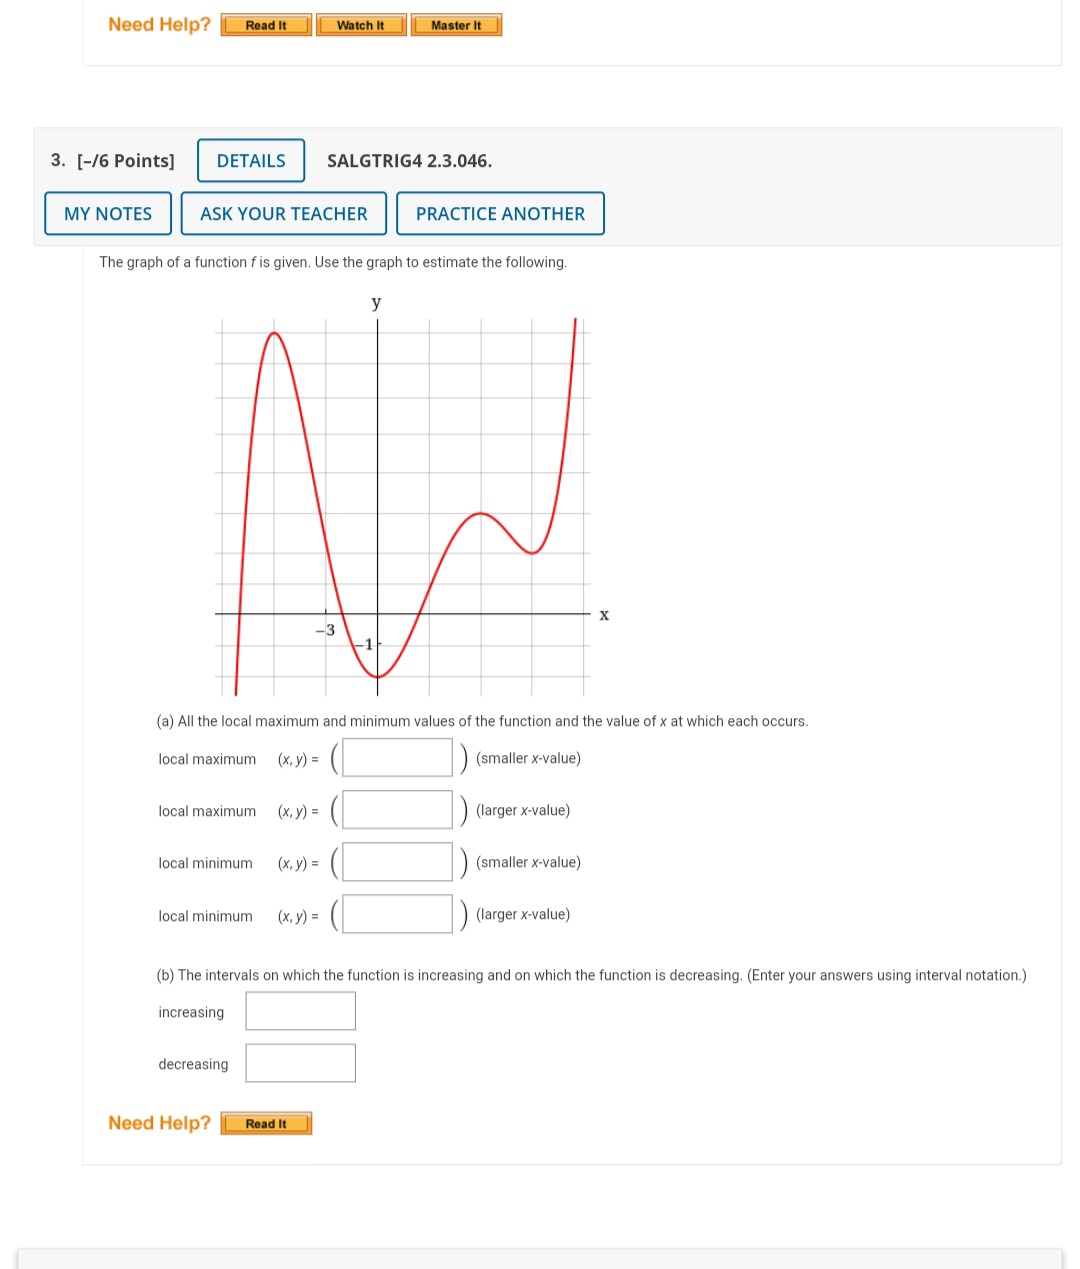
X 2.2_2.3_190_classw... . . . webassign.net Your last submission is used for your score. 1. [-/6 Points] DETAILS SALGTRIG4 2.2.009. 0/100 Submissions Used MY NOTES ASK YOUR TEACHER Sketch the graph of the function by first making a table of values. f(x) = -x2 f(x) = -x2 0 +4 +3 +2 + 1 Sketch the graph. 4 20 20 10 10 -20 . X -10 10 20 -20 - X -10 10 20 -10 -10 O -20 O -20 . 4 20 20 10 10 -20 X -10 10 20 LX -20 -10 10 20 / 10 -10 O -20 O -20 Need Help? Read It Watch It2. [-/8 Points] DETAILS SALGTRIG4 2.2.011. 0/100 Submissions Used MY NOTES ASK YOUR TEACHER Sketch the graph of the function by first making a table of values. (If an answer is undefined, enter UNDEFINED.) g(x) = -(x + 5)2 g(x) = -(x+5)2 -5 -3 -2 w - Sketch the graph. 20 20 10/ 10 X -10 -5 5 10 -10 -5 5 10 -10 -10 -20 -20 O O 4 20 20 10 10 -10 - X 5 10 X -10 -5 10 - 10 -10 -20 -20 O Need Help? Read It3. [-/8 Points] DETAILS SALGTRIG4 2.2.015. 0/100 Submissions Used MY NOTES ASK YOUR TEACHER Sketch the graph of the function by first making a table of values. g(x) = x3 - 5 X g(x) = x3 - 5 -3 -2 -1 0 W N - Sketch the graph. 4 15 15 10 10 5 5 . X -15 -10 -5 5 - X 10 15 - 15 -10 -5 5 10 15 -10 15 O 15 1......: 4 4 15/ 15- 10 10- 5 -15 -10 - 5 5 10 15 -15 -10 -5 5 10 15 -5 -5 10 O O -15 Need Help? Read It Watch It Submit Answer Viewing Saved Work Revert to Last Response11:33 & 1:12:49 Ill 90% 5. [-/4 Points] DETAILS SALGTRIG4 2.2.051. 0/100 Submissions Used MY NOTES ASK YOUR TEACHER Use the Vertical Line Test to determine whether the curve is the graph of a function of x. (a is a function is not a function (b) 0 is a function O is not a function (c) 0 is a function is not a function (d) O is a function is not a function Need Help? Read It Watch It 6. [-/3 Points] DETAILS SALGTRIG4 2.2.053.MI. 0/100 Submissions Used MY NOTES ASK YOUR TEACHER Consider the following. Us 4 6 -4 -3 3 2 1 2 3 4 5 -1 -21 -3 -4 -5 Use the Vertical Line Test to determine whether the curve is the graph of a function of x. O Yes, the curve is a function of x. No, the curve is not a function of x. If the curve is a function, state the domain and range. (Enter your answers using interval notation. If the curve is not a function enter NONE.) domain ange O1. [-/5 Points] DETAILS SALGTRIG4 2.3.010. MY NOTES ASK YOUR TEACHER PRACTICE ANOTHER Graphs of the functions f and g are given. (a) Which is larger, f(1) or g(1)? Of(1) is larger. O g(1) is larger. ONeither is larger. (b) Which is larger, f(4) or g(4)? Of(4) is larger. O g(4) is larger. O Neither is larger. (c) Find the values of x for which f(x) = g(x). (Enter your answers as a comma-separated list.) X = (d) Find the values of x for which f(x) s g(x). O [1, 3) and (7, 8) O (1,2) and (5, 7) O [1, 2] and [5, 7] [2, 5] and [7, 8) O (2, 5) and (7, 8] (e) Find the values of x for which f(x) > g(x). O [1, 3) and (7, 8] O (1, 2) and (5, 7) O [1, 2] and [5, 7] [2, 5] and [7, 8) O (2, 5) and (7, 8] Need Help? Read It 2. [-/4 Points] DETAILS SALGTRIG4 2.3.032.MI. MY NOTES ASK YOUR TEACHER PRACTICE ANOTHER The graph of a function f is given. Use the graph to estimate the following. (Enter your answers using interval notation.) (a) The domain and range of f. domain range (b) The intervals on which f is increasing and on which f is decreasing. increasing decreasing Need Help? Read It Watch It Master ItNeed Help? Read It Watch it Master It 3. [-/6 Points] DETAILS SALGTRIG4 2.3.046. MY NOTES ASK YOUR TEACHER PRACTICE ANOTHER The graph of a function f is given. Use the graph to estimate the following. (a) All the local maximum and minimum values of the function and the value of x at which each occurs. local maximum (x, y) = (smaller x-value) local maximum (x, y) = (larger x-value) local minimum (x, y) = (smaller x-value) local minimum ( x, y ) = (larger x-value) (b) The intervals on which the function is increasing and on which the function is decreasing. (Enter your answers using interval notation.) increasing decreasing Need Help? Read It
Step by Step Solution
There are 3 Steps involved in it
1 Expert Approved Answer
Step: 1 Unlock
Question Has Been Solved by an Expert!
Get step-by-step solutions from verified subject matter experts
Step: 2 Unlock
Step: 3 Unlock
Students Have Also Explored These Related Mathematics Questions!