

Question: please be specific with your answer 11. Changes to the security market line The following graph plots the current security market line (SML) and indicates
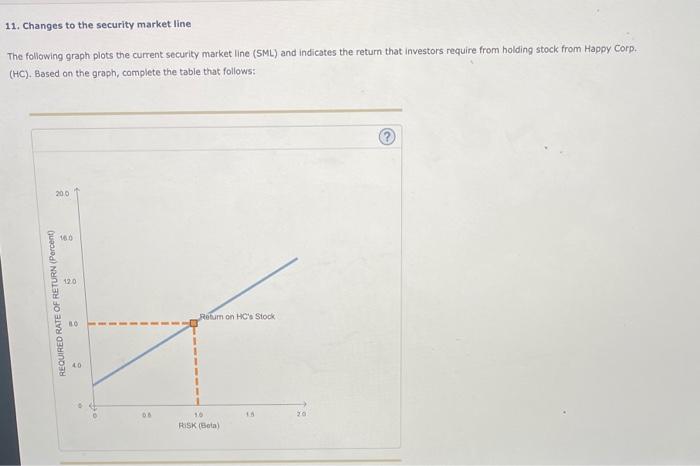
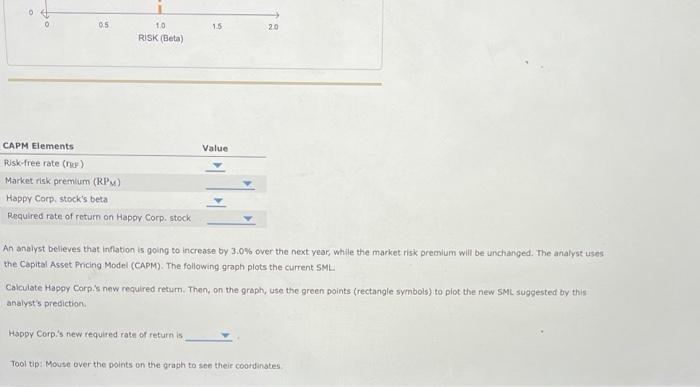
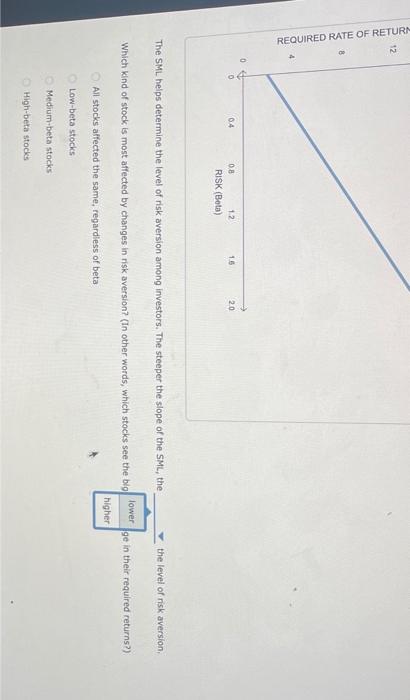
11. Changes to the security market line The following graph plots the current security market line (SML) and indicates the return that investors require from holding stock from Happy Corp. (HC). Based on the graph, complete the table that follows: n analyst believes that inflation is going to increase by 3.0% over the next year, while the market risk premlum will be unchanged. The analyst uses he Capital Asset Pricing Model (CAPM). The following 9 raph plots the current SML. Calculate Happy Corpi's new requiled return. Then, on the graph, use the green points (rectangle symbols) to plot the new SML suggested by this analyst's prediction Happy Corp.'s new requited rate of return is Tool tip: Mouse over the points on the graph to see their coordinates Tool tip: Mouse over the points on the graph to see their coordinates. The SML helps determine the level of risk aversion among investors. The steeper the slope of the SML, the the level of risk aversion. Which kind of stock is most affected by changes in risk aversion? (th other words, which stocks see the biggest change in their required returns?) All stocks affected the same, regardiess of beta The SML helps determine the level of risk aversion among investors. The steeper the slope of the SML, the the level of risk aversion. Which kind of stock is most affected by changes in risk aversion? (In other words, which stocks see the big, ie in their required returns?) All stocks affected the same, regardiess of beta Low-beta stocks Medium-beta stacks High-beta stocks
Step by Step Solution
There are 3 Steps involved in it

Get step-by-step solutions from verified subject matter experts