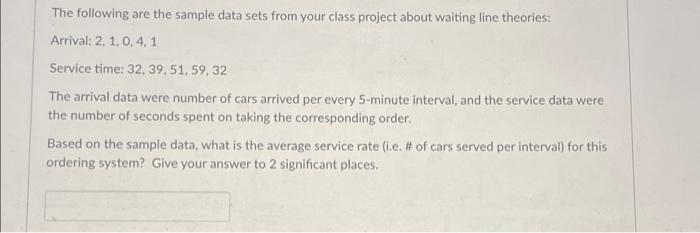
Question: Please bold/highlight answer and show all work The following are the sample data sets from your class project about waiting line theories: Arrival: 2, 1,

Please bold/highlight answer and show all work
The following are the sample data sets from your class project about waiting line theories: Arrival: 2, 1, 0, 4,1 Service time: 32, 39, 51, 59,32 The arrival data were number of cars arrived per every 5-minute interval, and the service data were the number of seconds spent on taking the corresponding order. Based on the sample data, what is the average service rate li.e. # of cars served per interval) for this ordering system? Give your answer to 2 significant places

Step by Step Solution

There are 3 Steps involved in it

1 Expert Approved Answer
Step: 1 Unlock blur-text-image
Question Has Been Solved by an Expert!

Get step-by-step solutions from verified subject matter experts

Step: 2 Unlock
Step: 3 Unlock

Students Have Also Explored These Related General Management Questions!