

Question: please break down and explain where ALL numbers in the equations come from The following table shows the actual demand observed over the last 11
please break down and explain where ALL numbers in the equations come from 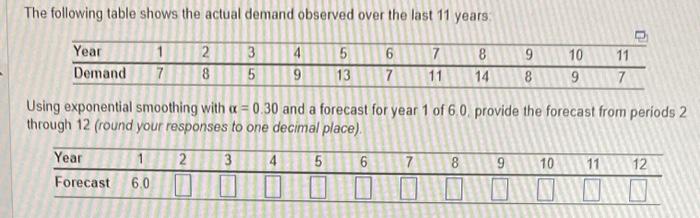
The following table shows the actual demand observed over the last 11 years: Using exponential smoothing with =0.30 and a forecast for year 1 of 6.0. provide the forecast from periods through 12 (round your responses to one decimal place)
Step by Step Solution
There are 3 Steps involved in it
1 Expert Approved Answer
Step: 1 Unlock

Question Has Been Solved by an Expert!
Get step-by-step solutions from verified subject matter experts
Step: 2 Unlock
Step: 3 Unlock