

Question: Please calculate FCF using the CFO and EBIT methods showing that they both are equal. INCOME STATEMENT (figures in millions) Historical 2018 19,095 (12,176) Forecast
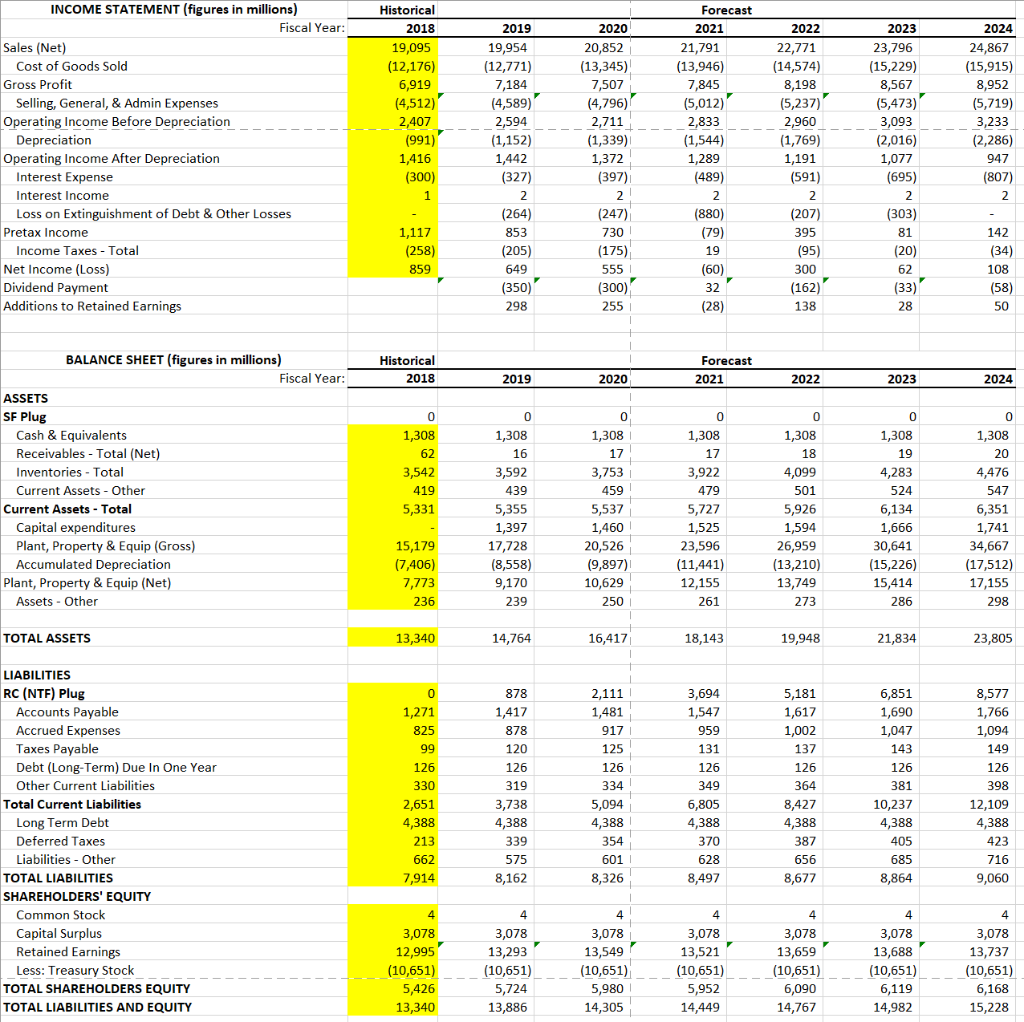
Please calculate FCF using the CFO and EBIT methods showing that they both are equal.
INCOME STATEMENT (figures in millions) Historical 2018 19,095 (12,176) Forecast Fiscal Year 2019 2020 2021 2022 2023 2024 Sales (Net) Gross Profit Operating Income Before Depreciation Operating Income After Depreciation 23,796 Cost of Goods Sold (12,771) (4,589) (1,1522711 (15,915) 8,952 Selling, General, & Admin Expenses (5,237) (5473) 2711-1544) (2,016)3,233 1,077 2,407 1,339)2,833 1,769)3,093 Depreciation (397) (591) (695) Interest Expense Interest Income Loss on Extinguishment of Debt & Other Losses (207) 395 Pretax Income (205) Income Taxes Total Net Income (Loss) Dividend Payment Additions to Retained Earnings (258) (162) BALANCE SHEET (figures in millions) Historical 2018 Forecast Fiscal Year: 2020 2023 2024 ASSETS 0 0 0 0 0 0 Lu Cash & Equivalents Receivables Total (Net) Inventories Total Current Assets Other 3,753 459 3,922 4,476 Current Assets-Total 5,926 Capital expenditures Plant, Property& Equip (Gross) Accumulated Depreciation 17,728 (8,558) 9,170 30,641 (15,226) 20,526 (9,897) 26,959 34,667 (17,512) 17,155 Plant, Property & Equip (Net) 12,155 Assets Other 286 TOTAL ASSETS 16,417 18,143 19,948 LIABILITIES RC (NTF) Plug 878 Accounts Payable Accrued Expenses Taxes Payable Debt (Long-Term) Due In One Year Other Current Liabilities 878 959 1,047 126 126 398 Total Current Liabilities 3,738 Long Term Debt Deferred Taxes Liabilities Other TOTAL LIABILITIES 628 8,162 8,677 9,060 SHAREHOLDERS' EQUITY Common Stock Capital Surplus Retained Earnings Less: Treasury Stock 4 3,078 13,659 3,078 12,995 3,078 3,078 13,737 13,293 13,549 6,090(10,651) 14,982 6119-(20,651) 15,228 (10,651) (10,651) 5,426(10,651) 5,952(10,651) TOTAL SHAREHOLDERS EQUITY TOTAL LIABILITIES AND EQUITY 14,449 14,767 INCOME STATEMENT (figures in millions) Historical 2018 19,095 (12,176) Forecast Fiscal Year 2019 2020 2021 2022 2023 2024 Sales (Net) Gross Profit Operating Income Before Depreciation Operating Income After Depreciation 23,796 Cost of Goods Sold (12,771) (4,589) (1,1522711 (15,915) 8,952 Selling, General, & Admin Expenses (5,237) (5473) 2711-1544) (2,016)3,233 1,077 2,407 1,339)2,833 1,769)3,093 Depreciation (397) (591) (695) Interest Expense Interest Income Loss on Extinguishment of Debt & Other Losses (207) 395 Pretax Income (205) Income Taxes Total Net Income (Loss) Dividend Payment Additions to Retained Earnings (258) (162) BALANCE SHEET (figures in millions) Historical 2018 Forecast Fiscal Year: 2020 2023 2024 ASSETS 0 0 0 0 0 0 Lu Cash & Equivalents Receivables Total (Net) Inventories Total Current Assets Other 3,753 459 3,922 4,476 Current Assets-Total 5,926 Capital expenditures Plant, Property& Equip (Gross) Accumulated Depreciation 17,728 (8,558) 9,170 30,641 (15,226) 20,526 (9,897) 26,959 34,667 (17,512) 17,155 Plant, Property & Equip (Net) 12,155 Assets Other 286 TOTAL ASSETS 16,417 18,143 19,948 LIABILITIES RC (NTF) Plug 878 Accounts Payable Accrued Expenses Taxes Payable Debt (Long-Term) Due In One Year Other Current Liabilities 878 959 1,047 126 126 398 Total Current Liabilities 3,738 Long Term Debt Deferred Taxes Liabilities Other TOTAL LIABILITIES 628 8,162 8,677 9,060 SHAREHOLDERS' EQUITY Common Stock Capital Surplus Retained Earnings Less: Treasury Stock 4 3,078 13,659 3,078 12,995 3,078 3,078 13,737 13,293 13,549 6,090(10,651) 14,982 6119-(20,651) 15,228 (10,651) (10,651) 5,426(10,651) 5,952(10,651) TOTAL SHAREHOLDERS EQUITY TOTAL LIABILITIES AND EQUITY 14,449 14,767
Step by Step Solution
There are 3 Steps involved in it

Get step-by-step solutions from verified subject matter experts