

Question: Please calculate missing information in Table 3. Case Created on April 2018 The University of Arizona Eller College of Management Undergraduate Programs Lyndsey Edmonds Financial
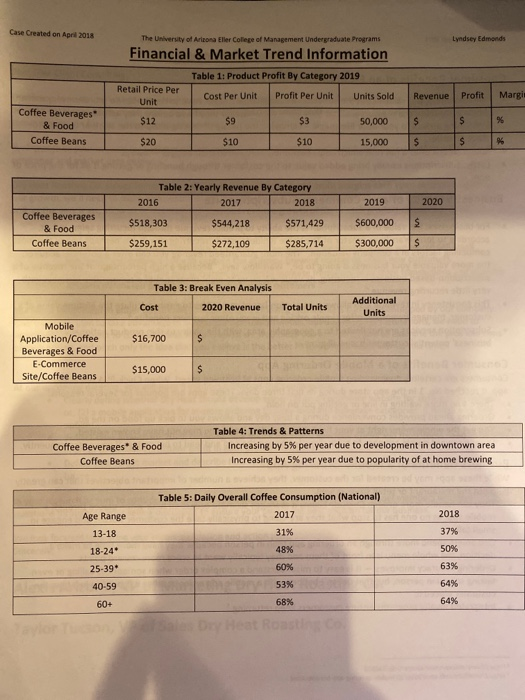
Case Created on April 2018 The University of Arizona Eller College of Management Undergraduate Programs Lyndsey Edmonds Financial & Market Trend Information Table 1: Product Profit By Category 2019 Retail Price Per Margi Profit Per Unit Revenue Profit Cost Per Unit Units Sold Unit Coffee Beverages % $12 $9 $3 50,000 $ & Food Coffee Beans $10 $ $20 $10 $ 15,000 Table 2: Yearly Revenue By Category 2019 2020 2016 2017 2018 Coffee Beverages $518,303 $600,000 $544,218 $571,429 & Food $ Coffee Beans $259,151 $300,000 $272,109 $285,714 Table 3: Break Even Analysis Additional Total Units Cost 2020 Revenue Units Mobile Application/Coffee Beverages & Food E-Commerce $16,700 $ $15,000 Site/Coffee Beans Table 4: Trends & Patterns Increasing by 5 % per year due to development in downtown area Increasing by 5% per year due to popularity of at home brewing Coffee Beverages & Food Coffee Beans Table 5: Daily Overall Coffee Consumption (National) 2018 2017 Age Range 37% 31% 13-18 50% 48% 18-24 60 % 63% 25-39 53 % 64 % 40-59 68 % 64% 60+
Step by Step Solution
There are 3 Steps involved in it

Get step-by-step solutions from verified subject matter experts