

Question: Please calculate the Dupont equation for Crocs using data from the case and from its Income Statement and Balance Sheet for 2007. Croc's margin for
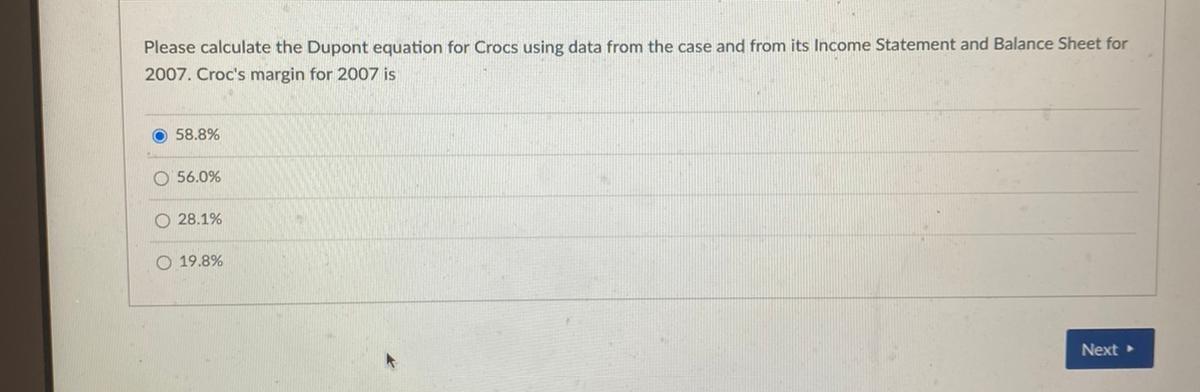
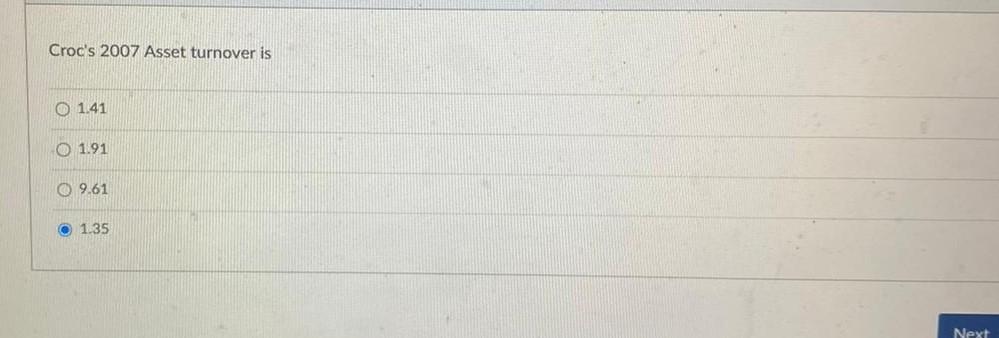
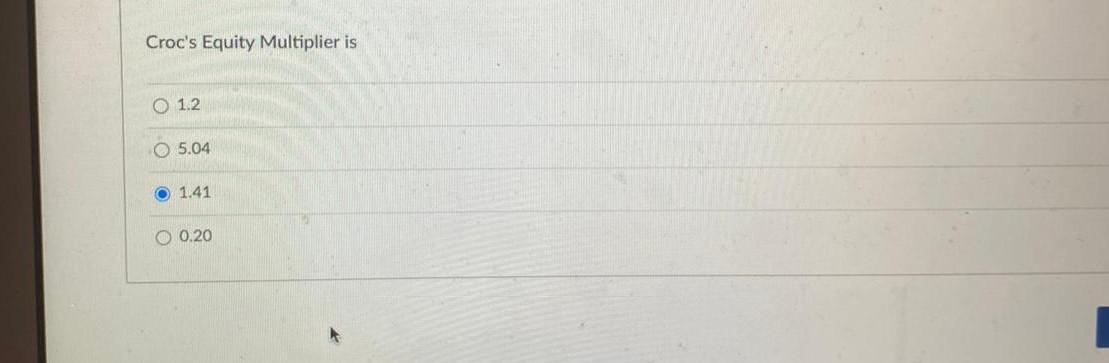
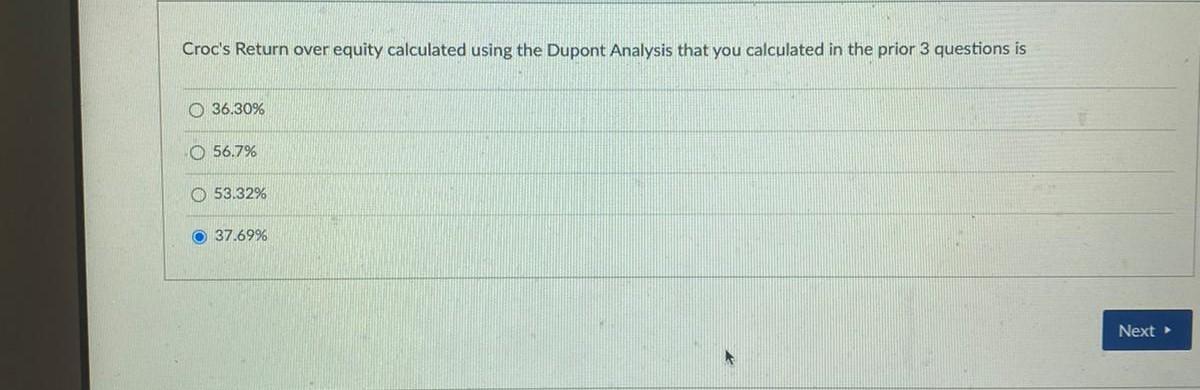
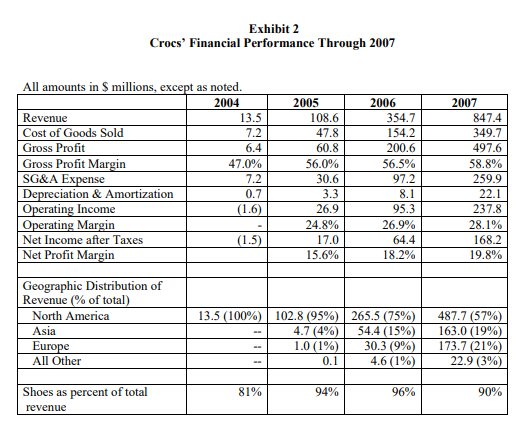
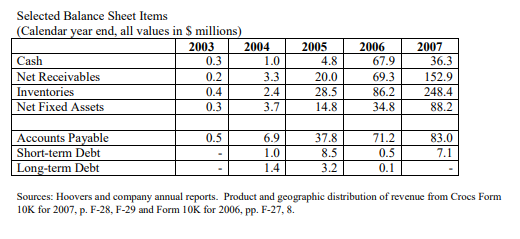
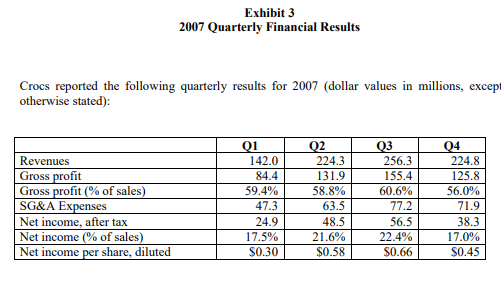
Please calculate the Dupont equation for Crocs using data from the case and from its Income Statement and Balance Sheet for 2007. Croc's margin for 2007 is 58.8% 0 56.0% O 28.1% O 19.8% Next Croc's 2007 Asset turnover is O 1.41 O 1.91 09.61 1.35 Next Croc's Equity Multiplier is O 1.2 O 5.04 1.41 O 0.20 Croc's Return over equity calculated using the Dupont Analysis that you calculated in the prior 3 questions is O 36.30% 56.7% O 53.32% 37.69% Next What can you infer from your Dupont analysis of Croc's ROE Crocs has a high ROE because it has very high leverage. o Crocs has a high ROE because it has high asset turnover o We cannot say anything about Crocs ROE Crocs has a high ROE because it has a high net margin. N Exhibit 2 Crocs Financial Performance Through 2007 All amounts in $ millions, except as noted. 2004 Revenue 13.5 Cost of Goods Sold 7.2 Gross Profit 6.4 Gross Profit Margin 47.0% SG&A Expense 7.2 Depreciation & Amortization 0.7 Operating Income (1.6) Operating Margin Net Income after Taxes (1.5) Net Profit Margin 2005 108.6 47.8 60.8 56.0% 30.6 3.3 26.9 24.8% 17.0 15.6% 2006 354.7 154.2 200.6 56.5% 97.2 8.1 95.3 26.9% 64.4 18.2% 2007 847.4 349.7 497.6 58.8% 259.9 22.1 237.8 28.1% 168,2 19.8% Geographic Distribution of Revenue (% of total) North America Asia Europe All Other 13.5 (100%) 102.8 (95%) 265.5 (75%) 4.7 (4%) 54.4 (15%) 1.0 (1%) 30.3 (9%) 0.1 4.6 (1%) 487.7 (57%) 163.0 (19%) 173.7 (21%) 22.9 (3%) 81% 94% 96% 90% Shoes as percent of total revenue Selected Balance Sheet Items (Calendar year end, all values in 9 millions) 2003 2004 Cash 0.3 1.0 Net Receivables 0.2 3.3 Inventories 0.4 2.4 Net Fixed Assets 0.3 3.7 2005 4.8 20.0 28.5 14.8 2006 67.9 69.3 86.2 34.8 2007 36.3 152.9 248.4 88.2 0.5 Accounts Payable Short-term Debt Long-term Debt 6.9 1.0 1.4 37.8 8.5 3.2 71.2 0.5 0.1 83.0 7.1 Sources: Hoovers and company annual reports. Product and geographic distribution of revenue from Crocs Form 10K for 2007, p. F-28, F-29 and Form 10K for 2006, pp. F-27, 8. Exhibit 3 2007 Quarterly Financial Results Crocs reported the following quarterly results for 2007 (dollar values in millions, except otherwise stated): Revenues Gross profit Gross profit (% of sales) SG&A Expenses Net income, after tax Net income (% of sales) Net income per share, diluted Q1 142.0 84.4 59.4% 47.3 24.9 17.5% $0.30 Q2 224.3 131.9 58.8% 63.5 48.5 21.6% $0.58 Q3 256.3 155.4 60.6% 77.2 56.5 22.4% $0.66 Q4 224.8 125.8 56.0% 71.9 38.3 17.0% $0.45
Step by Step Solution
There are 3 Steps involved in it

Get step-by-step solutions from verified subject matter experts