

Question: Please can someone explain me ho to interpret or read these graphs (figure 1 and 2) I want to know what are peak, maxima and
Please can someone explain me ho to interpret or read these graphs (figure 1 and 2)
I want to know what are peak, maxima and minimun?
The tables are sumary of the data, and the data was obtained by collecting the sound around schools using Decibel x pro sound meter
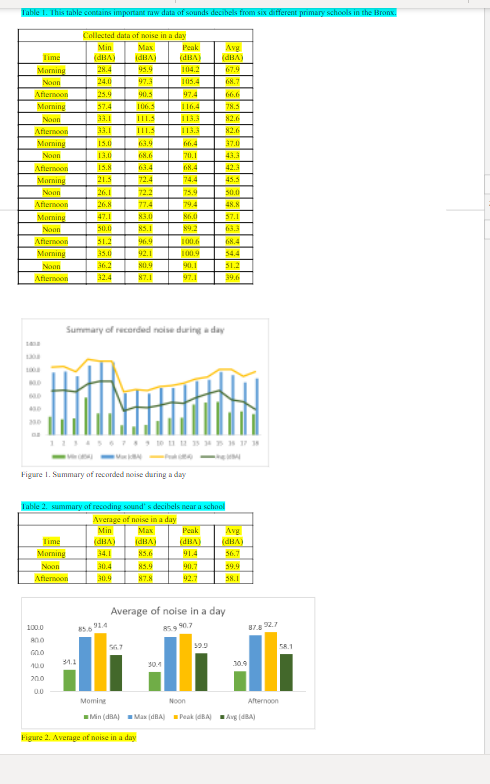
"Table 1. This table contains important row doin of sounds decibels from six different primary schools in the Bronx. Collected data of noise in a day Min Max Peak Avg Time dHA VHP dBA VEIPI Morning EH.4 104.2 67.9 Jonn 24.0 97.3 105.4 Afiemoon 25.9 97.4 Morning 57.4 106.3 1 16.4 H.5 Nonn 1 1.3 113.3 12.0 Anlemoor 33.1 111.3 013.3 42.6 Morning 15.0 17.0 Nonn 13.0 70. 43.3 fiemoor 15.8 16.4 12.3 Morning 21.3 724 74.4 Nonr 26. 72.2 75.9 50.0 Afiemoon 26.8 77.4 79.4 IN.8 Morning 47.1 57.1 Jonn 50.0 85. 1 89.2 Afiemoon 51.2 96.4 100.4 Morning 35.0 92. 100.9 Nonn 80.9 90. 1 51.2 Aremoon 32.4 87.1 97.1 59.0 Summary of recorded noise during a day Figure I. Summary of recorded noise during a day Table 2. summary of recoding sound's decibels near a school Average of noise in a day Min Max Peak Avg lime VHP VHPI dBA VHP Morning 34. 85.6 Noon 30.4 45.9 90. 59.9 Affemoon 30.4 87.8 92. Average of noise in a day 100.0 R3 9 90.7 AND 58.1 31.1 .10.9 Moming Noon Afternoon Min (dRA) Max (dBA] . Pook KBA] And34) Figure 2. Average of noise in a day
Step by Step Solution
There are 3 Steps involved in it

Get step-by-step solutions from verified subject matter experts