Question: Please can someone explain this to me step by step for part E. I am specifically looking at how to calculate it. The marginal slope
Please can someone explain this to me step by step for part E. I am specifically looking at how to calculate it. The marginal slope and partial slop.
Here is the data:
Transfer_Time_(sec) File_Size_(MB) Hours_past_8 18.4 22 0 22.4 22 0.0625 11.7 22 0.125 23.5 22 0.1875 16.2 23 0.25 12.1 23 0.3125 15.8 26 0.375 9.9 26 0.4375 15.1 26 0.5 16.6 26 0.5625 12.9 27 0.625 18.0 27 0.6875 16.7 29 0.75 17.7 29 0.8125 19.5 29 0.875 9.1 29 0.9375 15.4 29 1 15.0 29 1.0625 11.3 30 1.125 12.8 30 1.1875 20.9 31 1.25 19.9 31 1.3125 15.8 31 1.375 10.5 31 1.4375 17.8 31 1.5 26.4 31 1.5625 16.6 39 1.625 21.9 39 1.6875 18.5 40 1.75 26.0 40 1.8125 24.5 50 1.875 11.2 50 1.9375 25.2 52 2 15.4 52 2.0625 23.1 54 2.125 27.4 54 2.1875 20.9 54 2.25 38.3 54 2.3125 23.8 56 2.375 27.3 56 2.4375 19.3 59 2.5 35.2 59 2.5625 20.4 59 2.625 24.6 59 2.6875 21.8 60 2.75 20.6 60 2.8125 17.4 60 2.875 31.9 60 2.9375 22.4 63 3 26.0 63 3.0625 25.9 64 3.125 32.1 64 3.1875 22.6 71 3.25 37.4 71 3.3125 25.3 73 3.375 19.1 73 3.4375 25.4 74 3.5 41.1 74 3.5625 28.9 75 3.625 32.3 75 3.6875 28.3 86 3.75 43.8 86 3.8125 25.4 89 3.875 43.4 89 3.9375 33.4 89 4 49.9 89 4.0625 28.6 89 4.125 45.8 89 4.1875 28.5 90 4.25 32.8 90 4.3125 35.6 91 4.375 45.6 91 4.4375 24.5 93 4.5 41.2 93 4.5625 33.3 95 4.625 35.6 95 4.6875 31.4 98 4.75 43.1 98 4.8125 35.5 99 4.875 52.6 99 4.9375
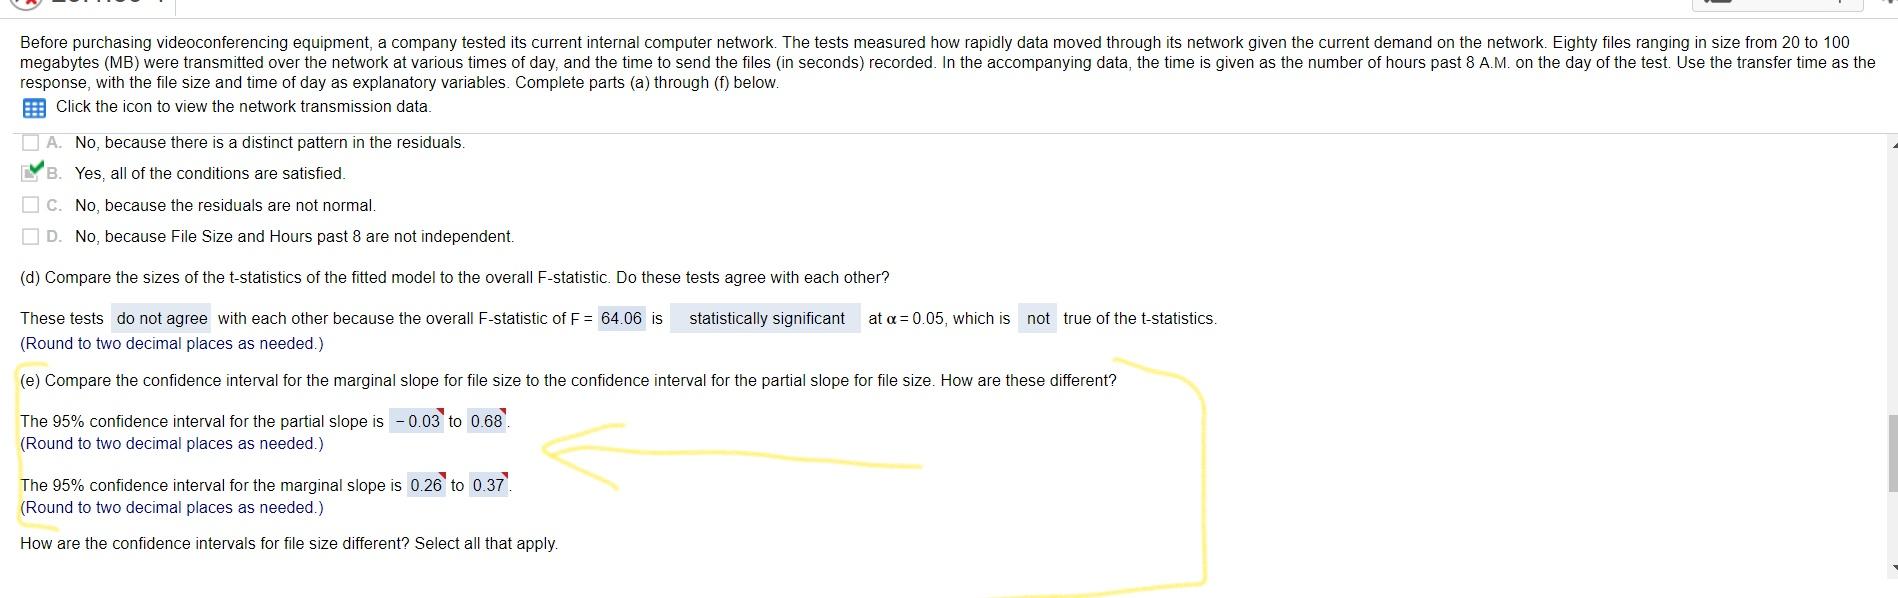
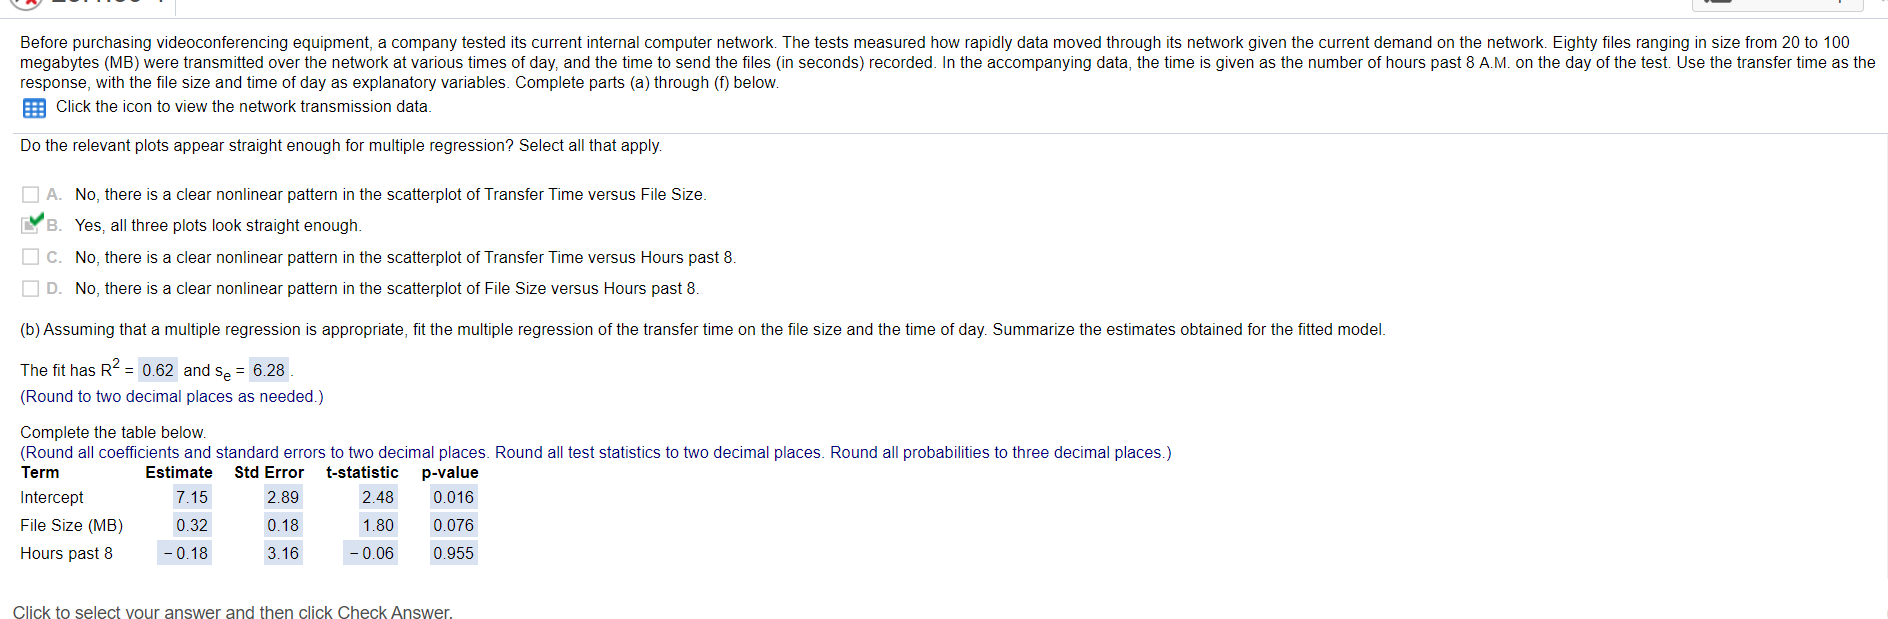
Before purchasing videoconferencing equipment, a company tested its current internal computer network. The tests measured how rapidly data moved through its network given the current demand on the network. Eighty files ranging in size from 20 to 100 megabytes (MB) were transmitted over the network at various times of day, and the time to send the files (in seconds) recorded. In the accompanying data, the time is given as the number of hours past 8 A.M. on the day of the test. Use the transfer time as the response, with the file size and time of day as explanatory variables. Complete parts (a) through (f) below. B!! Click the icon to view the network transmission data A. No, because there is a distinct pattern in the residuals. B. Yes, all of the conditions are satisfied. C. No, because the residuals are not normal. D. No, because File Size and Hours past 8 are not independent. (d) Compare the sizes of the t-statistics of the fitted model to the overall F-statistic. Do these tests agree with each other? statistically significant at a= 0.05, which is not true of the t-statistics. These tests do not agree with each other because the overall F-statistic of F= 64.06 is (Round to two decimal places as needed.) (e) Compare the confidence interval for the marginal slope for file size to the confidence interval for the partial slope for file size. How are these different? The 95% confidence interval for the partial slope is -0.03 to 0.68 (Round to two decimal places as needed.) The 95% confidence interval for the marginal slope is 0.26 to 0.37. (Round to two decimal places as needed.) How are the confidence intervals for file size different? Select all that apply. Before purchasing videoconferencing equipment, a company tested its current internal computer network. The tests measured how rapidly data moved through its network given the current demand on the network. Eighty files ranging in size from 20 to 100 megabytes (MB) were transmitted over the network at various times of day, and the time to send the files in seconds) recorded. In the accompanying data, the time is given as the number of hours past 8 A.M. on the day of the test. Use the transfer time as the response, with the file size and time of day as explanatory variables. Complete parts (a) through (f) below. Click the icon to view the network transmission data. Do the relevant plots appear straight enough for multiple regression? Select all that apply. I A. No, there is a clear nonlinear pattern in the scatterplot of Transfer Time versus File Size. CYB. Yes, all three plots look straight enough. IC. No, there is a clear nonlinear pattern in the scatterplot of Transfer Time versus Hours past 8. ID. No, there is a clear nonlinear pattern in the scatterplot of File Size versus Hours past 8. (b) Assuming that a multiple regression is appropriate, fit the multiple regression of the transfer time on the file size and the time of day. Summarize the estimates obtained for the fitted model. The fit has R2 = 0.62 and se = 6.28 (Round to two decimal places as needed.) Complete the table below. (Round all coefficients and standard errors to two decimal places. Round all test statistics to two decimal places. Round all probabilities to three decimal places.) Term Estimate Std Error t-statistic p-value Intercept 7.15 2.89 2.48 0.016 File Size (MB) 0.32 0.18 1.80 0.076 Hours past 8 -0.18 3.16 -0.06 0.955 Click to select your answer and then click Check Answer. Before purchasing videoconferencing equipment, a company tested its current internal computer network. The tests measured how rapidly data moved through its network given the current demand on the network. Eighty files ranging in size from 20 to 100 megabytes (MB) were transmitted over the network at various times of day, and the time to send the files (in seconds) recorded. In the accompanying data, the time is given as the number of hours past 8 A.M. on the day of the test. Use the transfer time as the response, with the file size and time of day as explanatory variables. Complete parts (a) through (f) below. B!! Click the icon to view the network transmission data A. No, because there is a distinct pattern in the residuals. B. Yes, all of the conditions are satisfied. C. No, because the residuals are not normal. D. No, because File Size and Hours past 8 are not independent. (d) Compare the sizes of the t-statistics of the fitted model to the overall F-statistic. Do these tests agree with each other? statistically significant at a= 0.05, which is not true of the t-statistics. These tests do not agree with each other because the overall F-statistic of F= 64.06 is (Round to two decimal places as needed.) (e) Compare the confidence interval for the marginal slope for file size to the confidence interval for the partial slope for file size. How are these different? The 95% confidence interval for the partial slope is -0.03 to 0.68 (Round to two decimal places as needed.) The 95% confidence interval for the marginal slope is 0.26 to 0.37. (Round to two decimal places as needed.) How are the confidence intervals for file size different? Select all that apply. Before purchasing videoconferencing equipment, a company tested its current internal computer network. The tests measured how rapidly data moved through its network given the current demand on the network. Eighty files ranging in size from 20 to 100 megabytes (MB) were transmitted over the network at various times of day, and the time to send the files in seconds) recorded. In the accompanying data, the time is given as the number of hours past 8 A.M. on the day of the test. Use the transfer time as the response, with the file size and time of day as explanatory variables. Complete parts (a) through (f) below. Click the icon to view the network transmission data. Do the relevant plots appear straight enough for multiple regression? Select all that apply. I A. No, there is a clear nonlinear pattern in the scatterplot of Transfer Time versus File Size. CYB. Yes, all three plots look straight enough. IC. No, there is a clear nonlinear pattern in the scatterplot of Transfer Time versus Hours past 8. ID. No, there is a clear nonlinear pattern in the scatterplot of File Size versus Hours past 8. (b) Assuming that a multiple regression is appropriate, fit the multiple regression of the transfer time on the file size and the time of day. Summarize the estimates obtained for the fitted model. The fit has R2 = 0.62 and se = 6.28 (Round to two decimal places as needed.) Complete the table below. (Round all coefficients and standard errors to two decimal places. Round all test statistics to two decimal places. Round all probabilities to three decimal places.) Term Estimate Std Error t-statistic p-value Intercept 7.15 2.89 2.48 0.016 File Size (MB) 0.32 0.18 1.80 0.076 Hours past 8 -0.18 3.16 -0.06 0.955 Click to select your answer and then click Check


