

Question: Please can someone help me answer this math questions Modeling 2 - ICE. Thanks Sign Signature Status Modeling 2 - ICE - Visualizing Growth Rates,
Please can someone help me answer this math questions Modeling 2 - ICE. Thanks
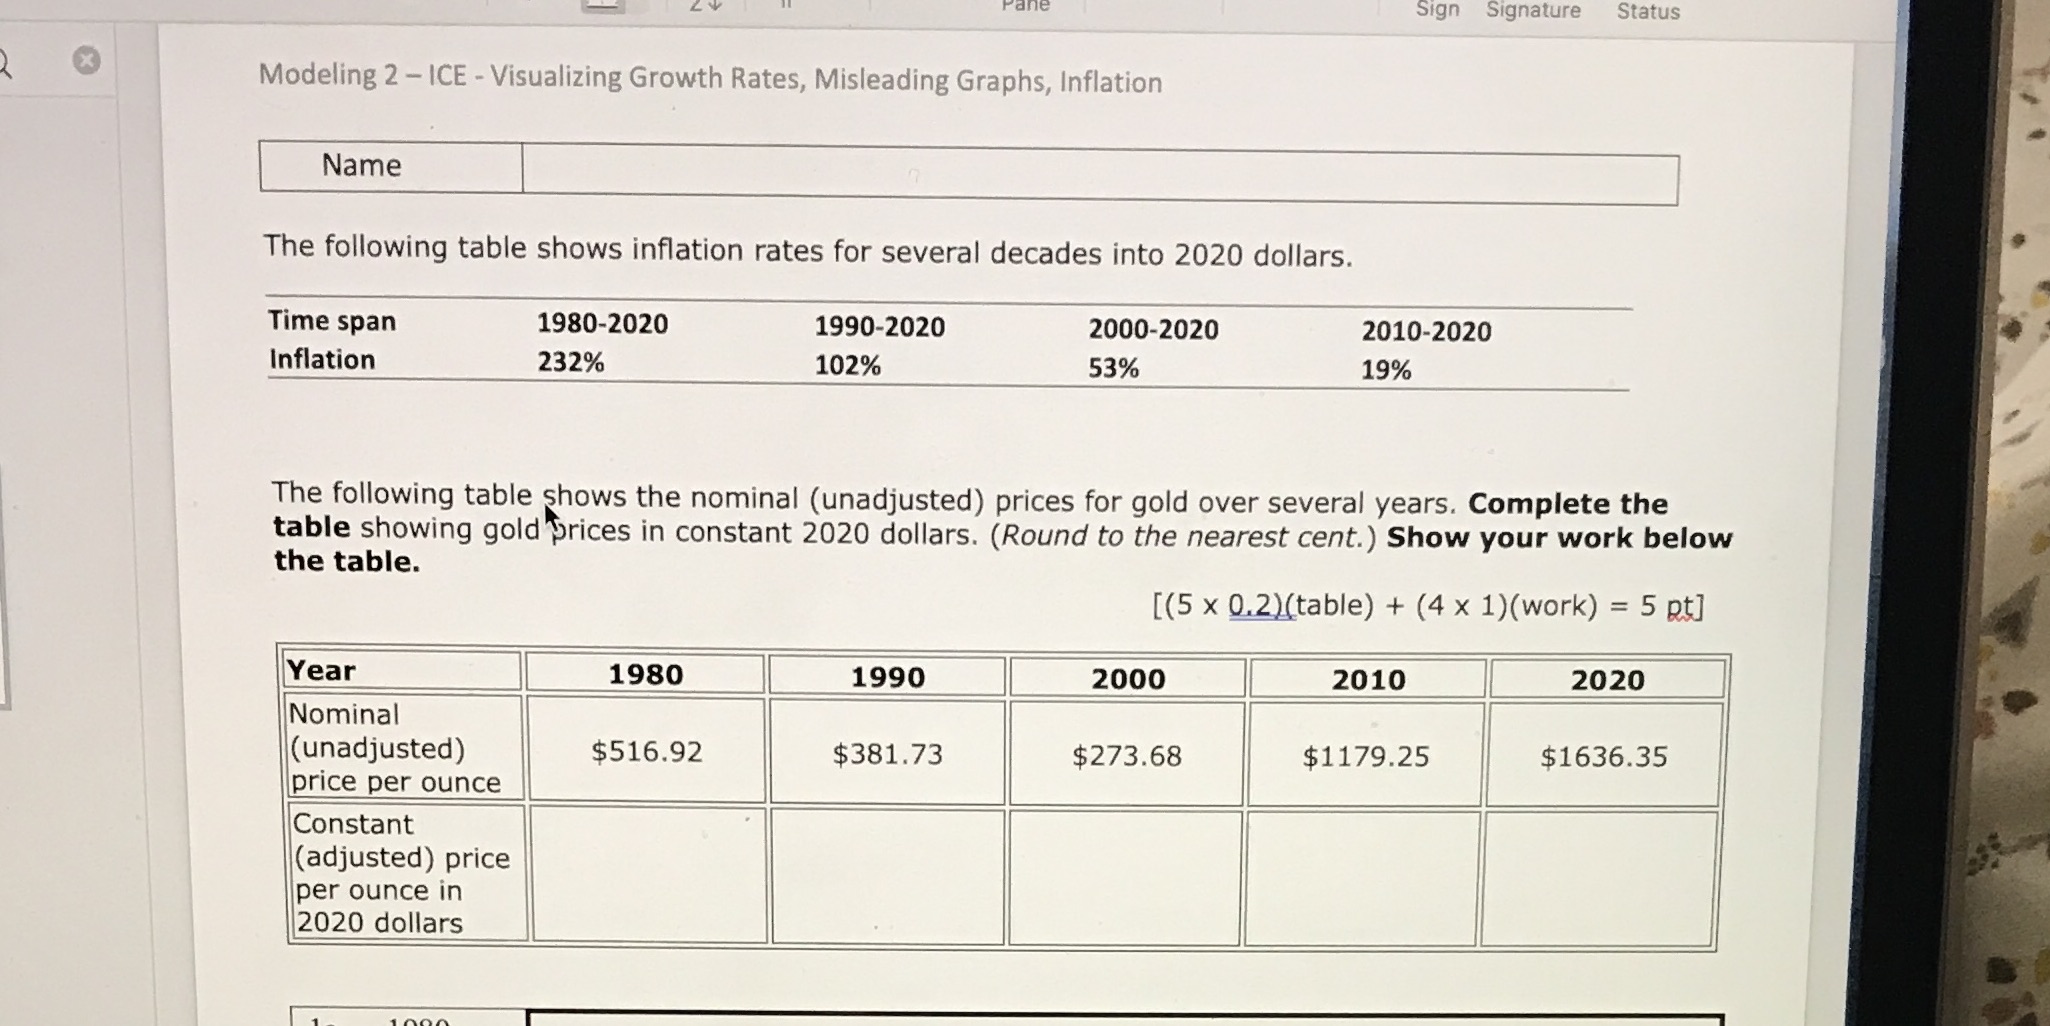
Sign Signature Status Modeling 2 - ICE - Visualizing Growth Rates, Misleading Graphs, Inflation Name The following table shows inflation rates for several decades into 2020 dollars. Time span 1980-2020 1990-2020 2000-2020 2010-2020 Inflation 232% 102% 53% 19% The following table shows the nominal (unadjusted) prices for gold over several years. Complete the table showing gold prices in constant 2020 dollars. (Round to the nearest cent. ) Show your work below the table. [(5 x 0.2)(table) + (4 x 1)(work) = 5 pt] Year 1980 1990 2000 2010 2020 Nominal (unadjusted) $516.92 $381.73 $273.68 $1179.25 $1636.35 price per ounce Constant (adjusted) price per ounce in 2020 dollars
Step by Step Solution
There are 3 Steps involved in it

Get step-by-step solutions from verified subject matter experts