

Question: Please can someone help me with this question, and give me the formula and answers thank you. Park Ridge Homecare's financial statements are presented in
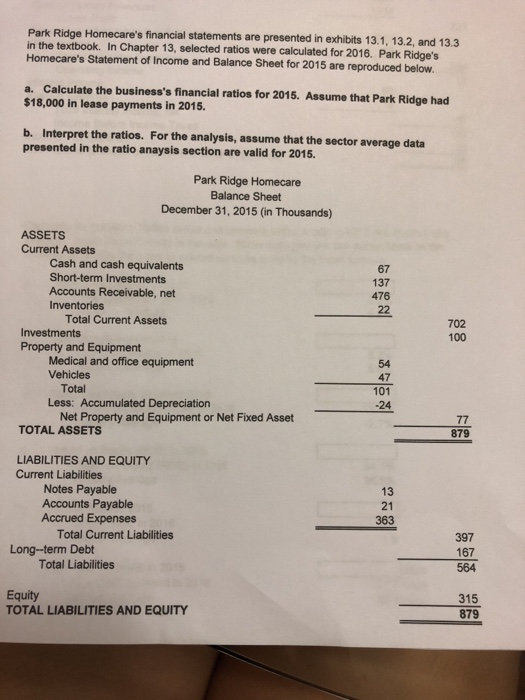
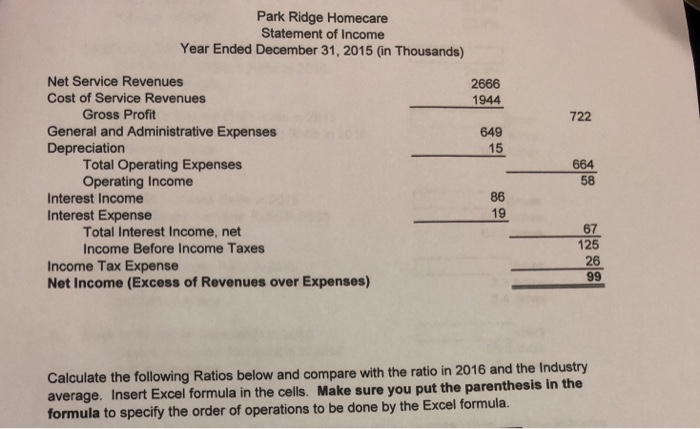
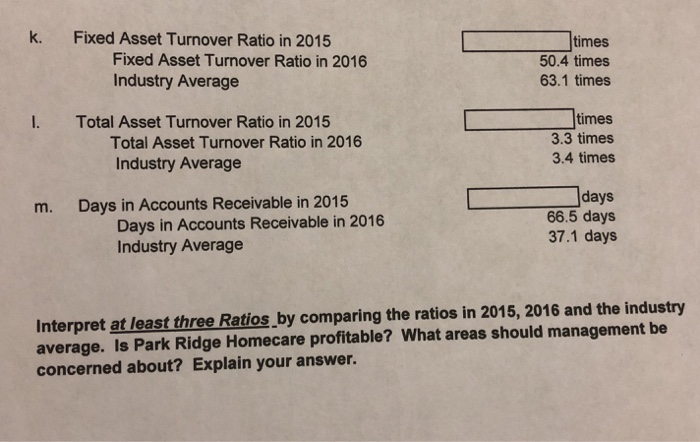
Park Ridge Homecare's financial statements are presented in exhibits 13.1, 13.2, and 13.3 in the textbook. In Chapter 13, selected ratios were calculated for 2016. Park Ridge's Homecare's Statement of Income and Balance Sheet for 2015 are reproduced below. a. Calculate the business's financial ratios for 2015. Assume that Park Ridge had $18,000 in lease payments in 2015. b. Interpret the ratios. For the analysis, assume that the sector average data presented in the ratio anaysis section are valid for 2015 Park Ridge Homecare Balance Sheet December 31, 2015 (in Thousands) ASSETS Current Assets Cash and cash equivalents Short-term Investments Accounts Receivable, net Inventories 67 137 476 Total Current Assets Investments Property and Equipment 702 100 Medical and office equipment Vehicles 54 47 101 -24 Total Less: Accumulated Depreciation Net Property and Equipment or Net Fixed Asset TOTAL ASSETS 879 LIABILITIES AND EQUITY Current Liabilities Notes Payable Accounts Payable Accrued Expenses 13 21 363 Total Current Liabilities 397 167 564 Long-term Debt Total Liabilities Equity TOTAL LIABILITIES AND EQUITY 879 Park Ridge Homecare Statement of Income Year Ended December 31, 2015 (in Thousands) Net Service Revenues Cost of Service Revenues 2666 1944 Gross Profit 722 General and Administrative Expenses Depreciation 649 15 Total Operating Expenses Operating Income 664 58 Interest Income Interest Expense 86 19 Total Interest Income, net Income Before Income Taxes 67 125 26 ncome Tax Expense Net Income (Excess of Revenues over Expenses) the ratio in 2016 and the Industry Calculate the following Ratios below and compare with average. Insert Excel formula in the cells. Make sure you put the parenthesis in the formula to specify the order of operations to be done by the Excel formula. times k. Fixed Asset Turnover Ratio in 2015 Fixed Asset Turnover Ratio in 2016 Industry Average 50.4 times 63.1 times times 3.3 times 3.4 times I. Total Asset Turnover Ratio in 2015 Total Asset Turnover Ratio in 2016 Industry Average days 66.5 days 37.1 days m. Days in Accounts Receivable in 2015 Days in Accounts Receivable in 2016 Industry Average Interpret at least three Ratios by comparing the ratios in 2015, 2016 and the industry average. Is Park Ridge Homecare profitable? What areas should management be concerned about? Explain your
Step by Step Solution
There are 3 Steps involved in it

Get step-by-step solutions from verified subject matter experts