

Question: PLEASE can someone solve this, and show ALL work ! 2. Draw a graph with two demand curves - one that is fairly elastic (labeled
PLEASE can someone solve this, and show ALL work !
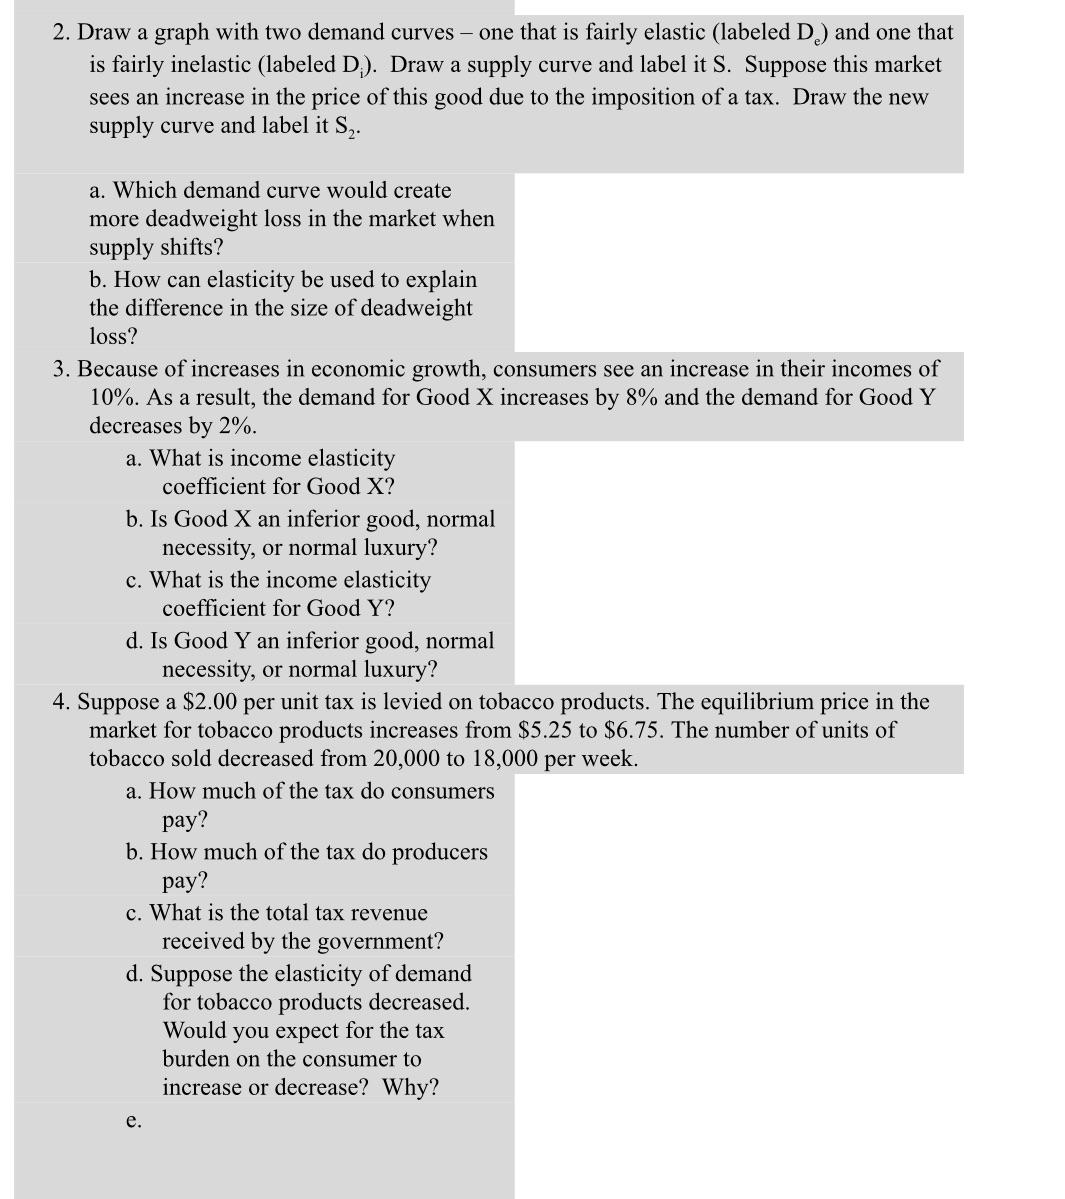
2. Draw a graph with two demand curves - one that is fairly elastic (labeled D ) and one that is fairly inelastic (labeled D;). Draw a supply curve and label it S. Suppose this market sees an increase in the price of this good due to the imposition of a tax. Draw the new supply curve and label it S2 a. Which demand curve would create more deadweight loss in the market when supply shifts? b. How can elasticity be used to explain the difference in the size of deadweight loss? 3. Because of increases in economic growth, consumers see an increase in their incomes of 10%. As a result, the demand for Good X increases by 8% and the demand for Good Y decreases by 2%. a. What is income elasticity coefficient for Good X? b. Is Good X an inferior good, normal necessity, or normal luxury? c. What is the income elasticity coefficient for Good Y? d. Is Good Y an inferior good, normal necessity, or normal luxury? 4. Suppose a $2.00 per unit tax is levied on tobacco products. The equilibrium price in the market for tobacco products increases from $5.25 to $6.75. The number of units of tobacco sold decreased from 20,000 to 18,000 per week. a. How much of the tax do consumers pay? b. How much of the tax do producers pay? c. What is the total tax revenue received by the government? d. Suppose the elasticity of demand for tobacco products decreased. Would you expect for the tax burden on the consumer to increase or decrease? Why? e
Step by Step Solution
There are 3 Steps involved in it

Get step-by-step solutions from verified subject matter experts