

Question: Please can you solve this for me and also explain how you got everything? (especially the part about data tables). Breakeven/Sensitivity Analyses In this worksheet
Please can you solve this for me and also explain how you got everything? (especially the part about data tables).
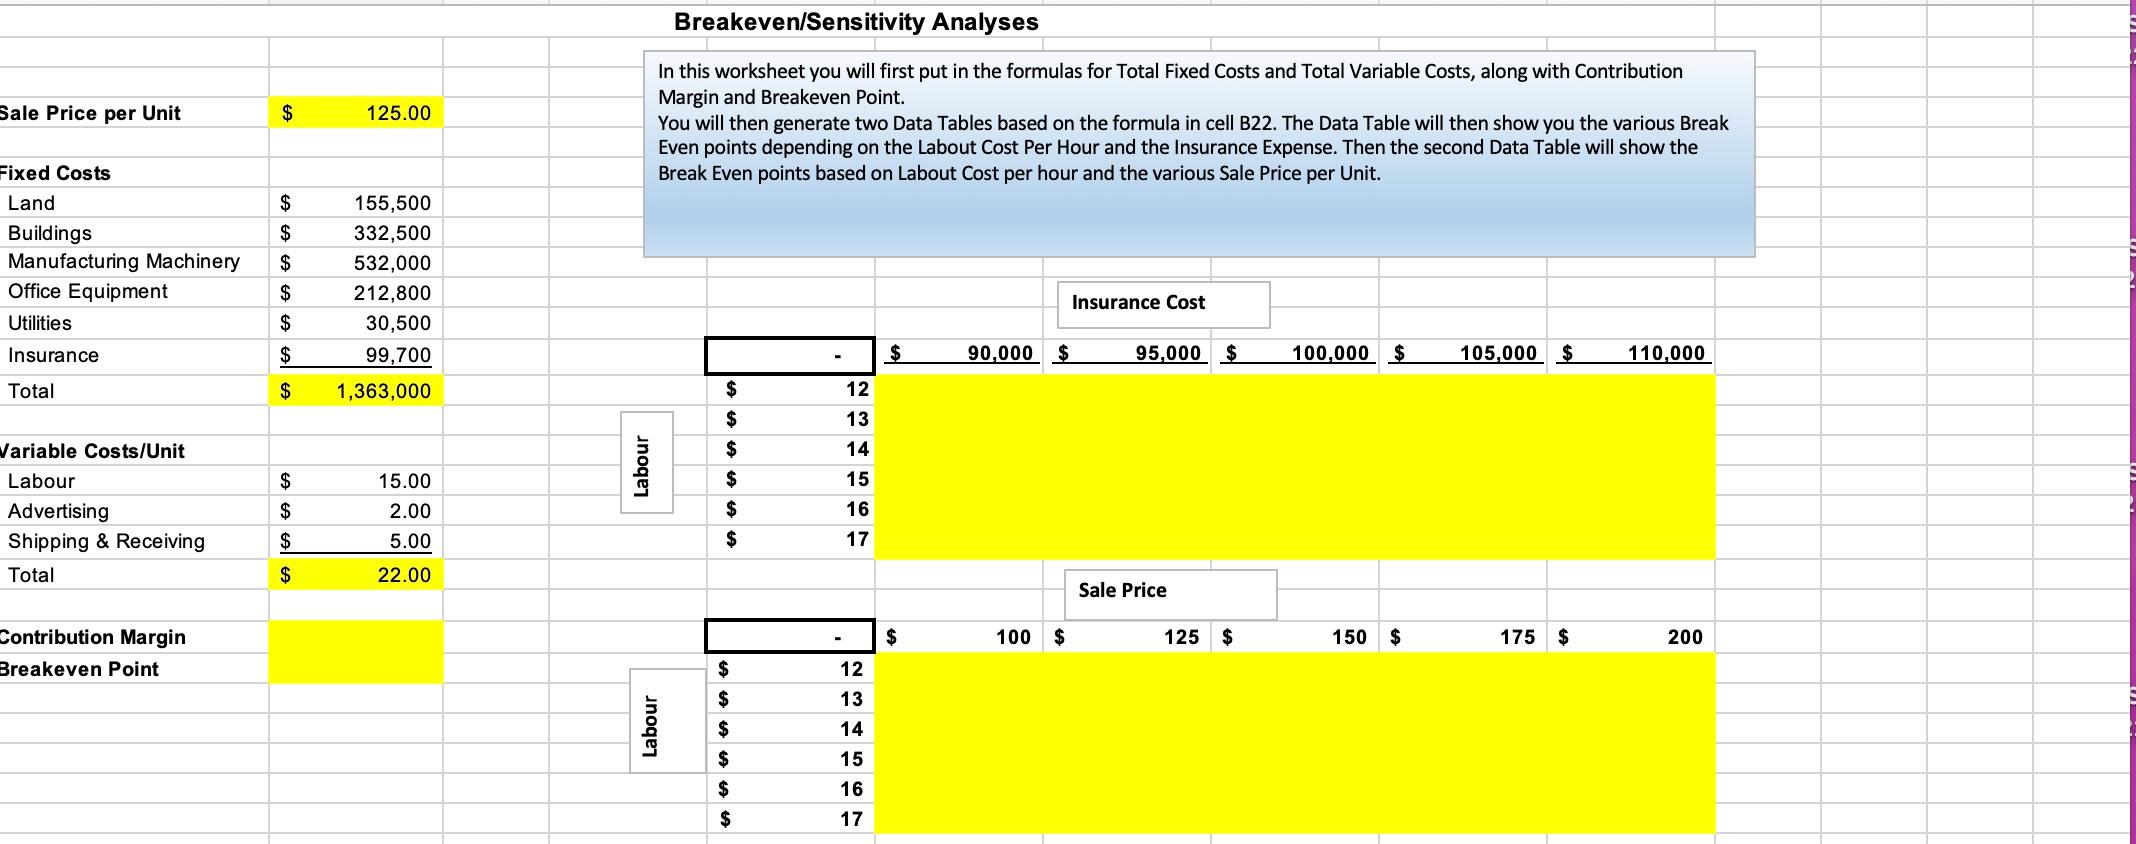
Breakeven/Sensitivity Analyses In this worksheet you will first put in the formulas for Total Fixed Costs and Total Variable Costs, along with Contribution Margin and Breakeven Point. You will then generate two Data Tables based on the formula in cell B22. The Data Table will then show you the various Break Even points depending on the Labout Cost Per Hour and the Insurance Expense. Then the second Data Table will show the Break Even points based on Labout Cost per hour and the various Sale Price per Unit. Fixed Costs Land \begin{tabular}{l|lr} \hline Buildings & $ & 155,500 \\ \hline Manufacturing Machinery & $ & 332,500 \\ \hline Office Equipment & $ & 532,000 \\ \hline Utilities & $ & 212,800 \\ \hline Insurance & $ & 30,500 \\ \hline Total & $99,700 \\ \hline \end{tabular} Variable Costs/Unit Labour Advertising Shipping \& Receiving Total \begin{tabular}{rr} $ & 15.00 \\ $ & 2.00 \\ $ & 5.00 \\ \hline$ & 22.00 \\ \hline \end{tabular} Insurance Cost Contribution Margin Breakeven Point \begin{tabular}{|l|ll|} \multicolumn{1}{c|}{} & & \\ \hline \multirow{3}{*}{ } & $ & 12 \\ \hline \multirow{0}{\mathrm{O}}{} & $ & 13 \\ \cline { 1 - 3 } & $ & 14 \\ \cline { 1 - 3 } & $ & 15 \\ \hline & $ & 16 \\ \hline$ & 17 \\ \hline \end{tabular} Sale Price 105,000$110,000Step by Step Solution
There are 3 Steps involved in it
1 Expert Approved Answer
Step: 1 Unlock

Question Has Been Solved by an Expert!
Get step-by-step solutions from verified subject matter experts
Step: 2 Unlock
Step: 3 Unlock