

Question: please change the depreciation rate and method from 5 years straight line MACRS and show the rates in your assumption area. the spreedsheet must include
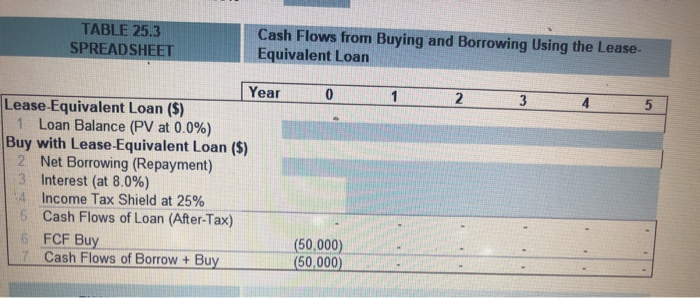
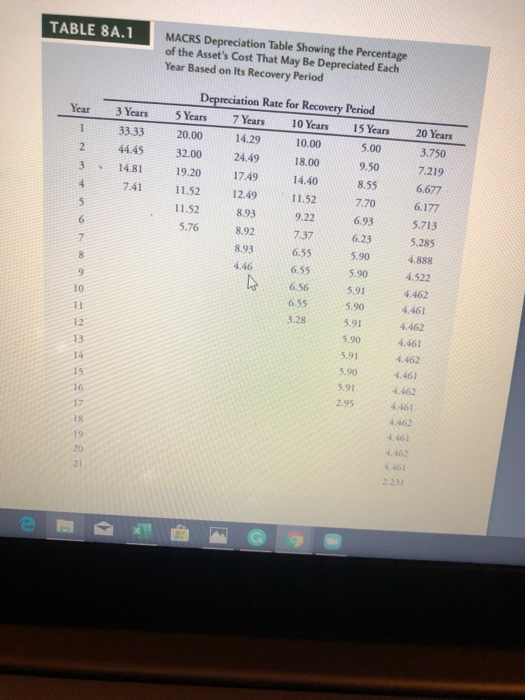
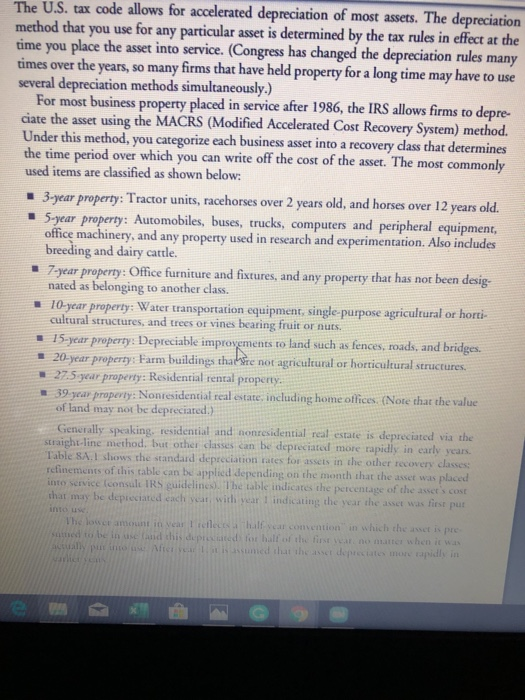
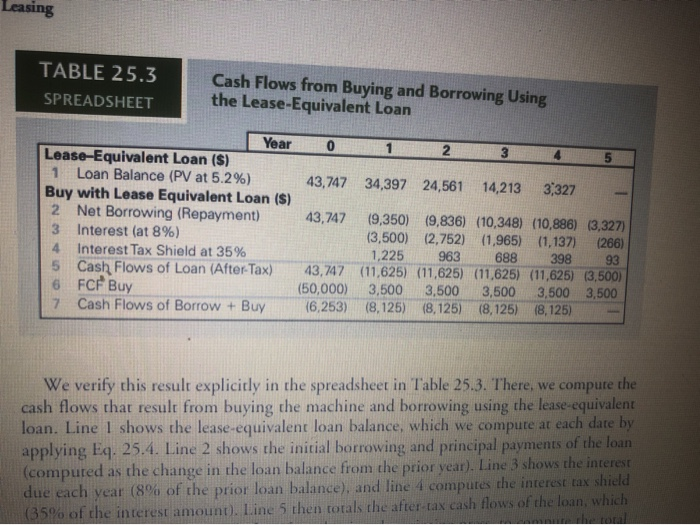
TABLE 25.3 SPREADSHEET Cash Flows from Buying and Borrowing Using the Lease- Equivalent Loan Year 012 Lease-Equivalent Loan ($) 1 Loan Balance (PV at 0.0%) Buy with Lease-Equivalent Loan ($) 2 Net Borrowing (Repayment) 13 Interest (at 8.0%) 4 Income Tax Shield at 25% Cash Flows of Loan (After-Tax) 6 FCF Buy (50,000) 7 Cash Flows of Borrow + Buy (50,000) TABLE 8A.1 MACRS Depreciation Table Showing the Percentage of the Asset's Cost That May Be Depreciated Each Year Based on Its Recovery Period Year 3 Years 33.33 44.45 Depreciation Rate for Recovery Period 5 Years 7 Years 10 Years 15 Years 20.00 14.29 10.00 5.00 32.00 24.49 18.00 9.50 19.20 17.49 14.40 8.55 11.52 11.52 7.70 11.52 8.93 6.93 5.76 7.37 6.23 14.81 5.90 20 Years 3.750 7.219 6.677 6.177 5.713 5.285 4.88 4.522 4.462 4.461 4.462 4.461 4.462 4.461 4.462 5.90 5.91 wo The U.S. tax code allows for accelerated depreciation of most assets. The depreciation method that you use for any particular asset is determined by the tax rules in effect at the time you place the asset into service. (Congress has changed the depreciation rules many times over the years, so many firms that have held property for a long time may have to use several depreciation methods simultaneously.) For most business property placed in service after 1986, the IRS allows firms to depre- ciate the asset using the MACRS (Modified Accelerated Cost Recovery System) method. Under this method, you categorize each business asset into a recovery dass that determines the time period over which you can write off the cost of the asset. The most commonly used items are classified as shown below: 3-year property: Tractor units, racehorses over 2 years old, and horses over 12 years old. 5-year property: Automobiles, buses, trucks, computers and peripheral equipment, office machinery, and any property used in research and experimentation. Also includes breeding and dairy cattle. 7-year property: Office furniture and fixtures, and any property that has not been desig- nated as belonging to another class. ! 10-year property: Water transportation equipment, single-purpose agricultural or horti cultural structures, and trees or vines bearing fruit or nuts. 15-year property: Depreciable improvements to land such as fences, roads, and bridges. 20-year property: Farm buildings thabire not agricultural or horticultural structures. 27.5 war property: Residential rental property. 39 year property: Nonresidential real estate, including home offices. (Note that the value of land may not be depreciated.) Generally speaking, residential and nonresidential real estate is depreciated via the straight-line method. but other classes can be depreciated more rapidly in early years. Table SA.shows the standard depreciation rates for assets in the other recovery classes: refinements of this table can be applied depending on the month that the asset was placed into service consult IRS guidelines. The table indicates the percentage of the assets cost that may be dipluciated each nur with year indicating the war the asset was first put. to The lower amount in var lite half car consention in which the asset is pres stood to be in un and his diplwared in half of the line will no matter when it was actually the A s sumed that the deprecated in Leasing TABLE 25.3 SPREADSHEET Cash Flows from Buying and Borrowing Using the Lease-Equivalent Loan 23 34,397 24,561 14,213 3,327 Year Lease-Equivalent Loan (S) 1 Loan Balance (PV at 5.2%) 43,747 Buy with Lease Equivalent Loan (S) 2 Net Borrowing (Repayment) 43,747 3 Interest (at 8%) 4 Interest Tax Shield at 35% 5 Cash Flows of Loan (After-Tax) 43,747 FCF Buy (50,000) 7 Cash Flows of Borrow + Buy (6,253) (9,350) (9,836) (10,348) (10,886) (3,327) (3,500) (2,752) (1,965) (1,137) (266) 1,225 963 688 398 93 (11,625) (11,625) (11,625) (11,625) (3,500) 3,500 3,500 3,500 3,500 3,500 (8,125) (8,125) (8,125) (8,125) We verify this result explicitly in the spreadsheet in Table 25.3. There we compute the cash flows that result from buying the machine and borrowing using the lease-equivalent loan. Line I shows the lease equivalent loan balance, which we compute at each date by applying Eq. 25.4. Line 2 shows the initial borrowing and principal payments of the loan (computed as the change in the loan balance from the prior year). Line 3 shows the interest due each vear (8% of the prior loan balance), and line 4 computes the interest tax shield 35% of the interest amount). Line 5 then torals the after-tax cash flows of the loan, which TABLE 25.3 SPREADSHEET Cash Flows from Buying and Borrowing Using the Lease- Equivalent Loan Year 012 Lease-Equivalent Loan ($) 1 Loan Balance (PV at 0.0%) Buy with Lease-Equivalent Loan ($) 2 Net Borrowing (Repayment) 13 Interest (at 8.0%) 4 Income Tax Shield at 25% Cash Flows of Loan (After-Tax) 6 FCF Buy (50,000) 7 Cash Flows of Borrow + Buy (50,000) TABLE 8A.1 MACRS Depreciation Table Showing the Percentage of the Asset's Cost That May Be Depreciated Each Year Based on Its Recovery Period Year 3 Years 33.33 44.45 Depreciation Rate for Recovery Period 5 Years 7 Years 10 Years 15 Years 20.00 14.29 10.00 5.00 32.00 24.49 18.00 9.50 19.20 17.49 14.40 8.55 11.52 11.52 7.70 11.52 8.93 6.93 5.76 7.37 6.23 14.81 5.90 20 Years 3.750 7.219 6.677 6.177 5.713 5.285 4.88 4.522 4.462 4.461 4.462 4.461 4.462 4.461 4.462 5.90 5.91 wo The U.S. tax code allows for accelerated depreciation of most assets. The depreciation method that you use for any particular asset is determined by the tax rules in effect at the time you place the asset into service. (Congress has changed the depreciation rules many times over the years, so many firms that have held property for a long time may have to use several depreciation methods simultaneously.) For most business property placed in service after 1986, the IRS allows firms to depre- ciate the asset using the MACRS (Modified Accelerated Cost Recovery System) method. Under this method, you categorize each business asset into a recovery dass that determines the time period over which you can write off the cost of the asset. The most commonly used items are classified as shown below: 3-year property: Tractor units, racehorses over 2 years old, and horses over 12 years old. 5-year property: Automobiles, buses, trucks, computers and peripheral equipment, office machinery, and any property used in research and experimentation. Also includes breeding and dairy cattle. 7-year property: Office furniture and fixtures, and any property that has not been desig- nated as belonging to another class. ! 10-year property: Water transportation equipment, single-purpose agricultural or horti cultural structures, and trees or vines bearing fruit or nuts. 15-year property: Depreciable improvements to land such as fences, roads, and bridges. 20-year property: Farm buildings thabire not agricultural or horticultural structures. 27.5 war property: Residential rental property. 39 year property: Nonresidential real estate, including home offices. (Note that the value of land may not be depreciated.) Generally speaking, residential and nonresidential real estate is depreciated via the straight-line method. but other classes can be depreciated more rapidly in early years. Table SA.shows the standard depreciation rates for assets in the other recovery classes: refinements of this table can be applied depending on the month that the asset was placed into service consult IRS guidelines. The table indicates the percentage of the assets cost that may be dipluciated each nur with year indicating the war the asset was first put. to The lower amount in var lite half car consention in which the asset is pres stood to be in un and his diplwared in half of the line will no matter when it was actually the A s sumed that the deprecated in Leasing TABLE 25.3 SPREADSHEET Cash Flows from Buying and Borrowing Using the Lease-Equivalent Loan 23 34,397 24,561 14,213 3,327 Year Lease-Equivalent Loan (S) 1 Loan Balance (PV at 5.2%) 43,747 Buy with Lease Equivalent Loan (S) 2 Net Borrowing (Repayment) 43,747 3 Interest (at 8%) 4 Interest Tax Shield at 35% 5 Cash Flows of Loan (After-Tax) 43,747 FCF Buy (50,000) 7 Cash Flows of Borrow + Buy (6,253) (9,350) (9,836) (10,348) (10,886) (3,327) (3,500) (2,752) (1,965) (1,137) (266) 1,225 963 688 398 93 (11,625) (11,625) (11,625) (11,625) (3,500) 3,500 3,500 3,500 3,500 3,500 (8,125) (8,125) (8,125) (8,125) We verify this result explicitly in the spreadsheet in Table 25.3. There we compute the cash flows that result from buying the machine and borrowing using the lease-equivalent loan. Line I shows the lease equivalent loan balance, which we compute at each date by applying Eq. 25.4. Line 2 shows the initial borrowing and principal payments of the loan (computed as the change in the loan balance from the prior year). Line 3 shows the interest due each vear (8% of the prior loan balance), and line 4 computes the interest tax shield 35% of the interest amount). Line 5 then torals the after-tax cash flows of the loan, which
Step by Step Solution
There are 3 Steps involved in it

Get step-by-step solutions from verified subject matter experts