

Question: Please choose correct graph Math 150 Intro to Statistics BMCC Spring 2022 Homework: Section 10.1 Homework Question 7, 10.1.21-T HW Score: 72.92%, 5.83 of 8
Please choose correct graph
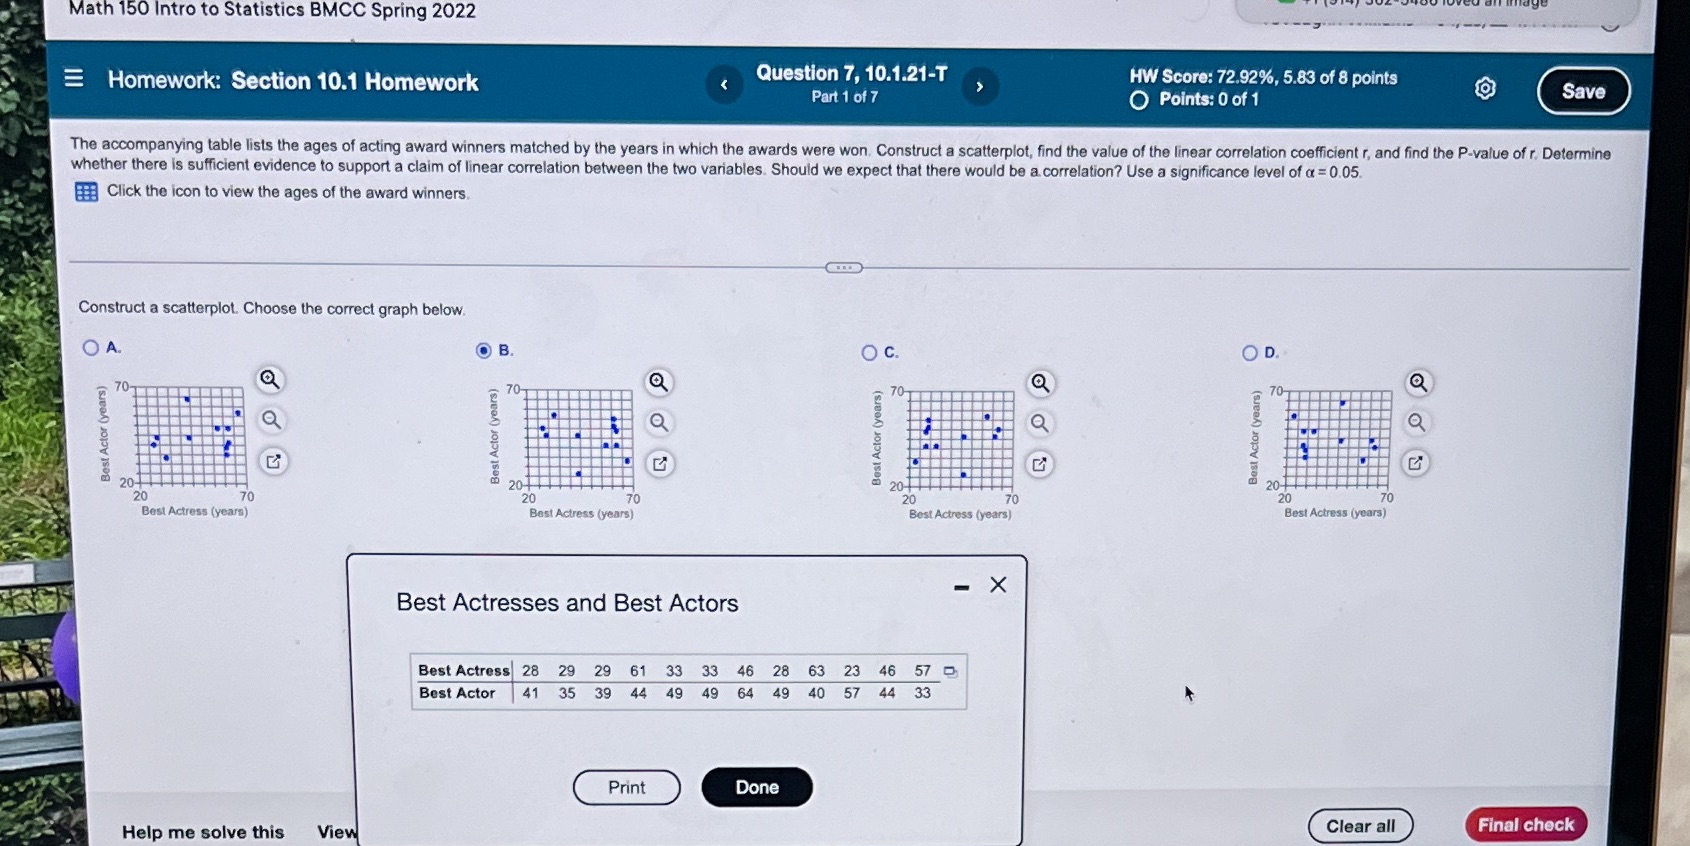
Math 150 Intro to Statistics BMCC Spring 2022 Homework: Section 10.1 Homework Question 7, 10.1.21-T HW Score: 72.92%, 5.83 of 8 points Part 1 of 7 Points: 0 of 1 Save The accompanying table lists the ages of acting award winners matched by the years in which the awards were won. Construct a scatterplot, find the value of the linear correlation coefficient r, and find the P-value of r. Determine whether there is sufficient evidence to support a claim of linear correlation between the two variables. Should we expect that there would be a correlation? Use a significance level of a = 0.05. Click the icon to view the ages of the award winners. Construct a scatterplot. Choose the correct graph below. OA OB O C. O D. 70 T 70 70 Best Actor (years) Best Actor (years) Best Actor (years) Best Actor (years) C 20-4 204 20- 20 20 20 70 20 70 Best Actress (years) Best Actress (years) Best Actress (years) Best Actress (years) - X Best Actresses and Best Actors Best Actress 28 29 29 61 33 33 46 28 63 23 46 57 Best Actor 41 35 39 44 49 49 64 49 40 57 44 33 Print Done Clear all Final check Help me solve this View
Step by Step Solution
There are 3 Steps involved in it

Get step-by-step solutions from verified subject matter experts