

Question: please clear answer in details for making hard decision b00k ,thank you Explain why the lines separating the three regions in Figure 5.11 (page 203
 please clear answer in details for making hard decision b00k ,thank you
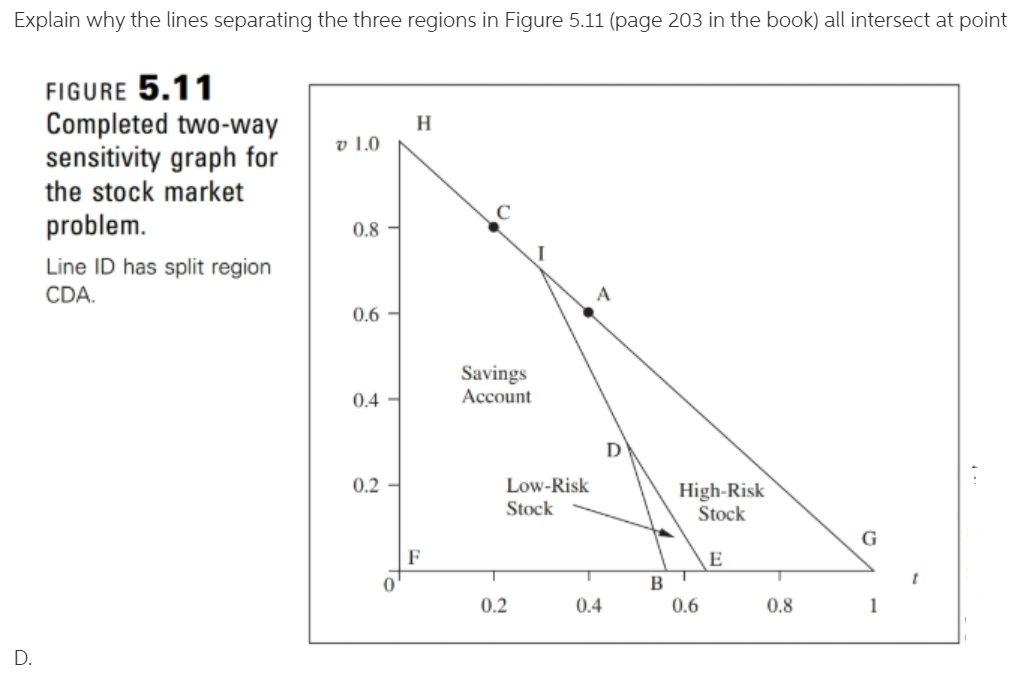
Explain why the lines separating the three regions in Figure 5.11 (page 203 in the book) all intersect at point v 1.0 FIGURE 5.11 Completed two-way sensitivity graph for the stock market problem. Line ID has split region CDA. Savings Account 0.4 0.2 Low-Risk Stock High-Risk Stock 0.4 0.6 Explain why the lines separating the three regions in Figure 5.11 (page 203 in the book) all intersect at point v 1.0 FIGURE 5.11 Completed two-way sensitivity graph for the stock market problem. Line ID has split region CDA. Savings Account 0.4 0.2 Low-Risk Stock High-Risk Stock 0.4 0.6
Step by Step Solution
There are 3 Steps involved in it
1 Expert Approved Answer
Step: 1 Unlock

Question Has Been Solved by an Expert!
Get step-by-step solutions from verified subject matter experts
Step: 2 Unlock
Step: 3 Unlock