

Question: PLEASE CODE THE FLOW CHART IN PYTHON 1994 Weekly gas averages 0.992 0.995 1.001 0.999 1.005 1.007 1.016 1.009 1.004 1.007 1.005 1.007 1.012 1.011
 PLEASE CODE THE FLOW CHART IN PYTHON
1994 Weekly gas averages
0.992
0.995
1.001
0.999
1.005
1.007
1.016
1.009
1.004
1.007
1.005
1.007
1.012
1.011
1.028
1.033
1.037
1.04
1.045
1.046
1.05
1.056
1.065
1.073
1.079
1.095
1.097
1.103
1.109
1.114
1.13
1.157
1.161
1.165
1.161
1.156
1.15
1.14
1.129
1.12
1.114
1.106
1.107
1.121
1.123
1.122
1.113
1.117
1.127
1.131
1.134
1.125
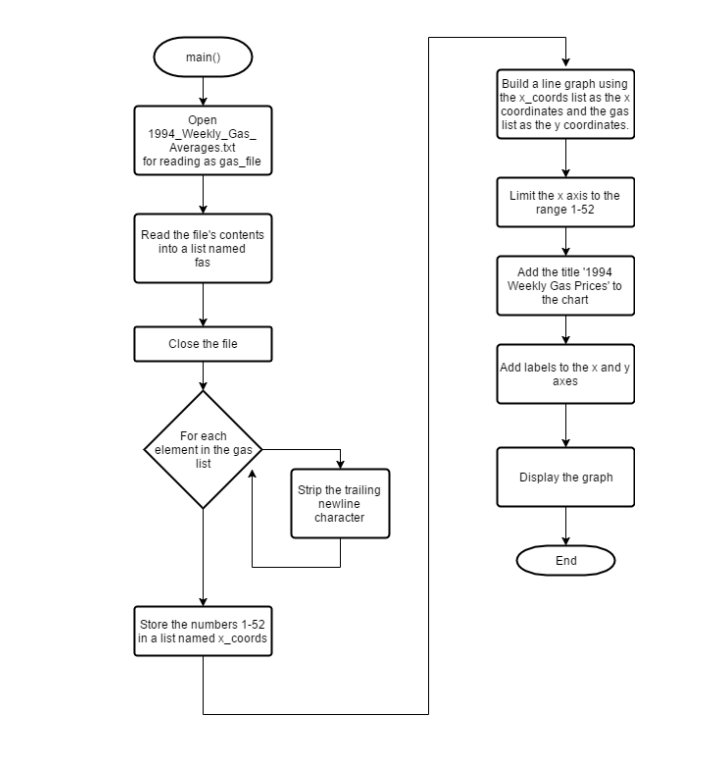
main0 Build a line graph using the x_coords list as the x coordinates and the gas list as the y coordinates Open 1994_Weekly_Gas Averages.tt for reading as gas file Limit the x axis to the range 1-52 Read the file's contents into a list named Add the title '1994 Weekly Gas Prices' to the chart Close the file Add labels to the x and y axes For each element in the gas list Display the graph Strip the trailing newline character End Store the numbers 1-52 in a list named x_coords main0 Build a line graph using the x_coords list as the x coordinates and the gas list as the y coordinates Open 1994_Weekly_Gas Averages.tt for reading as gas file Limit the x axis to the range 1-52 Read the file's contents into a list named Add the title '1994 Weekly Gas Prices' to the chart Close the file Add labels to the x and y axes For each element in the gas list Display the graph Strip the trailing newline character End Store the numbers 1-52 in a list named x_coords
Step by Step Solution
There are 3 Steps involved in it

Get step-by-step solutions from verified subject matter experts