

Question: please complete all 2 parts . thank you Data for McClane Designs, Inc. follow. (Click the icon to view the data.) Read the requirements Requirement
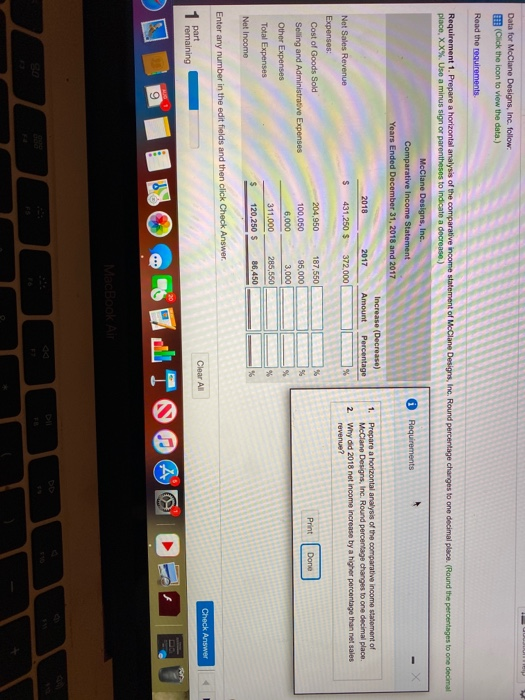
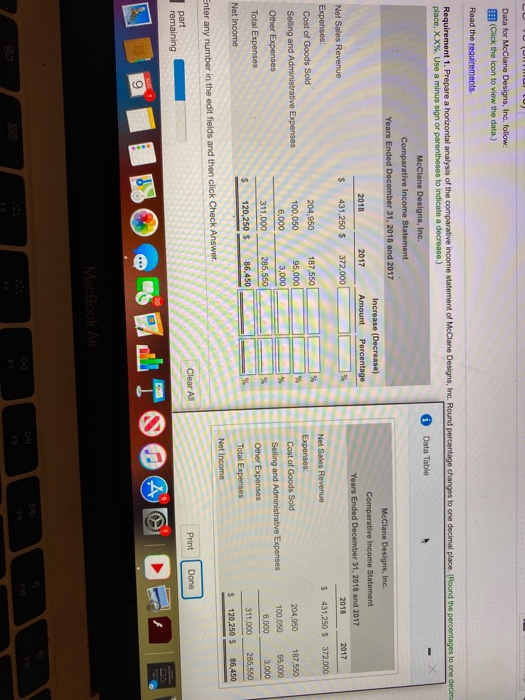
Data for McClane Designs, Inc. follow. (Click the icon to view the data.) Read the requirements Requirement 1. Prepare a horizontal analysis of the comparative income statement of McClane Designs, Inc. Round percentage changes to one decimal place. (Round the percentages to one decimal place, XX%. Use a minus sign or parentheses to indicato a decrease) McClane Designs, Inc. Comparative Income Statement i Requirements Years Ended December 31, 2018 and 2017 Increase (Decrease) 1 Prepare a horizontal analysis of the comparative income statement of 2018 2017 Amount Percentage McClane Designs, Inc. Round percentage changes to one decimal place Net Sales Revenue $ 431,250 $ 372,000 2 Why did 2018 net income increase by a higher percentage than net sales revenue? Expenses: Cost of Goods Sold 204,950 187,550 Print Done Selling and Administrative Expenses 100.050 95,000 Other Expenses 6.000 3,000 311,000 285,550 Total Expenses 120,250 S 86,450 Net Income 5 Enter any number in the edit fields and then click Check Answer. Check Answer Clear All 1 Dar remaining 9 MacBook Air Data for McClane Designs, Inc. follow: (Click the icon to view the data) Read the requirements Requirement 1. Prepare a horizontal analysis of the comparative income statement of McClane Designs, Inc. Round percentage changes to one decimal place. (Round the percentages to one decima place, X.X%. Use a minus sign or parentheses to indicate a decrease.) McClane Designs, Inc. Data Table Comparative Income Statement Years Ended December 31, 2018 and 2017 McClane Designs, Inc. Increase (Decrease) 2018 2017 Amount Comparative Income Statement Percentage Years Ended December 31, 2018 and 2017 Net Sales Revenue $ 431,250 $ 372.000 2018 2017 Expenses Net Sales Revenue $ 431,250 $ 372,000 Cost of Goods Sold 204.950 187,550 Expenses: Soling and Administrative Expenses 100,050 95,000 % Cost of Goods Sold 204,950 187 550 Other Expenses 6.000 3,000 % Selling and Administrative Expenses 100.050 95.000 311,000 285,550 %6 Total Expenses 6,000 3,000 Other Expenses $ 120,250 $ 86,450 311.000 285,550 Net Income Total Expenses $ 120.250 $ 86,450 Net Income Enter any number in the edit fields and then click Check Answer. Clear All Print Done part remaining MacBook Air
Step by Step Solution
There are 3 Steps involved in it

Get step-by-step solutions from verified subject matter experts