

Question: PLEASE COMPLETE ALL 3 REQUIREMENTS WITH WORK! WILL LEAVE A REVIEW Thomas Department Stores' chief executive officer (CEO) has asked you to compare the company's
PLEASE COMPLETE ALL 3 REQUIREMENTS WITH WORK! WILL LEAVE A REVIEW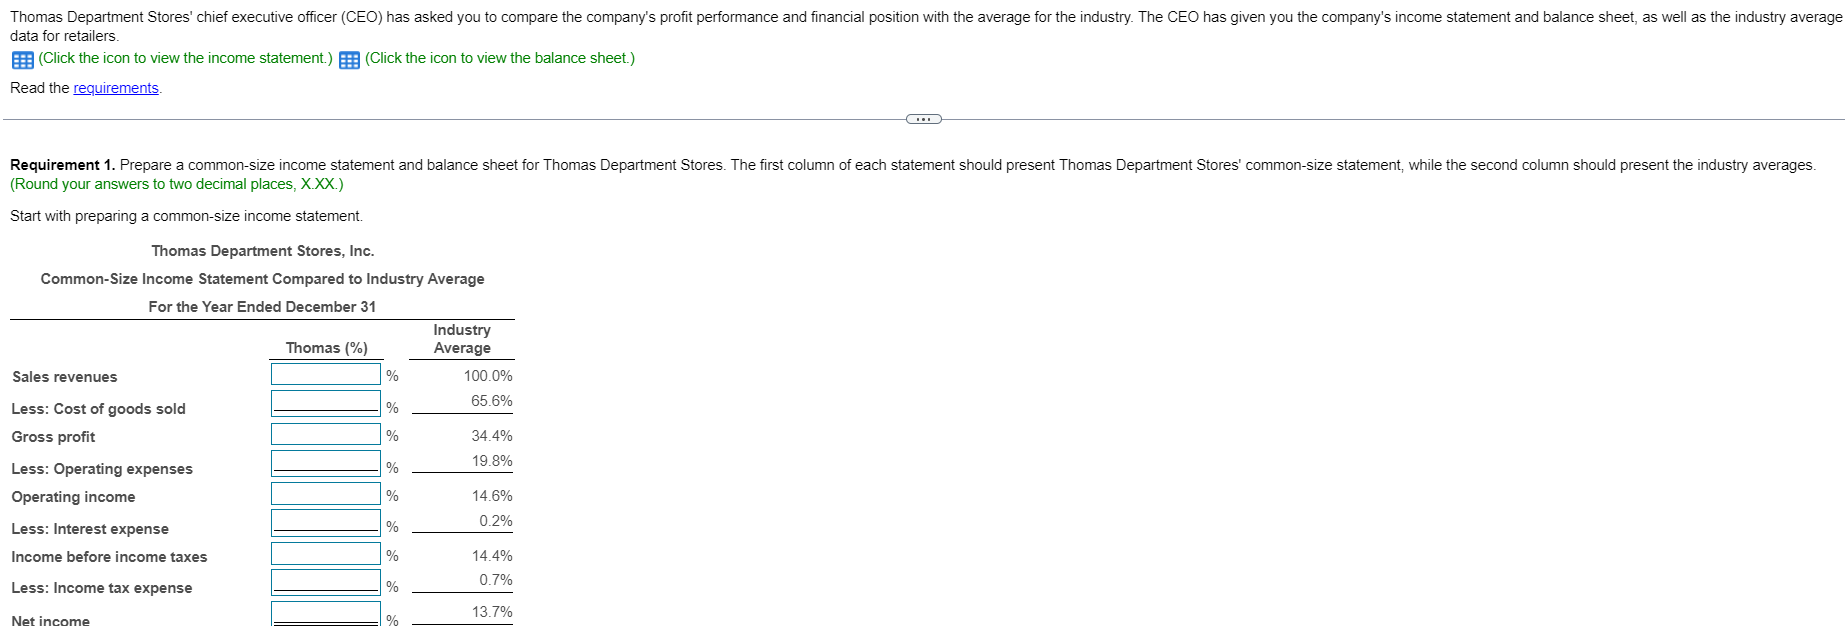
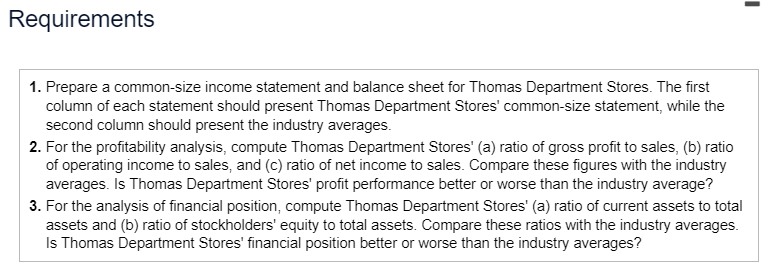
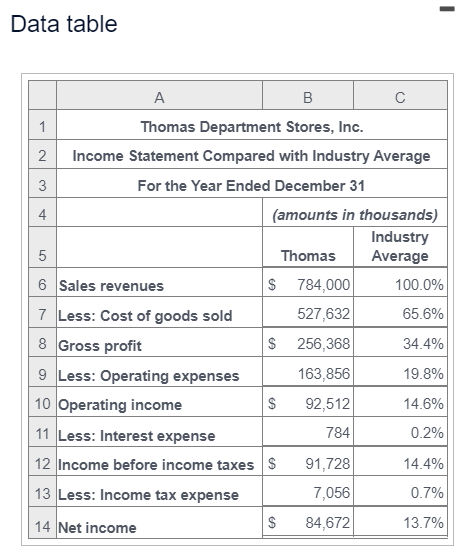
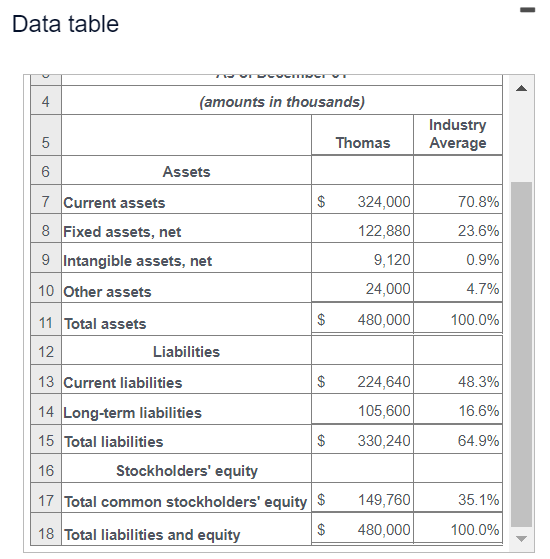
Thomas Department Stores' chief executive officer (CEO) has asked you to compare the company's profit performance and financial position with the average for the industry. The CEO has given you the company's income statement and balance sheet, as well as the industry average data for retailers. (Click the icon to view the income statement.) (Click the icon to view the balance sheet.) Read the requirements Requirement 1. Prepare a common-size income statement and balance sheet for Thomas Department Stores. The first column of each statement should present Thomas Department Stores' common-size statement, while the second column should present the industry averages. (Round your answers to two decimal places, X.XX.) Start with preparing a common-size income statement. Thomas Department Stores, Inc. Common-Size Income Statement Compared to Industry Average For the Year Ended December 31 Industry Thomas (%) Average Sales revenues % 100.0% 65.6% Less: Cost of goods sold Gross profit % 34.4% 19.8% Less: Operating expenses Operating income % 14.6% 0.2% Less: Interest expense Income before income taxes 14.4% 0.7% Less: Income tax expense 13.7% Net income - Requirements 1. Prepare a common-size income statement and balance sheet for Thomas Department Stores. The first column of each statement should present Thomas Department Stores' common-size statement, while the second column should present the industry averages. 2. For the profitability analysis, compute Thomas Department Stores' (a) ratio of gross profit to sales, (b) ratio of operating income to sales, and (c) ratio of net income to sales. Compare these figures with the industry averages. Is Thomas Department Stores' profit performance better or worse than the industry average? 3. For the analysis of financial position, compute Thomas Department Stores' (a) ratio of current assets to total assets and (b) ratio of stockholders' equity to total assets. Compare these ratios with the industry averages. Is Thomas Department Stores' financial position better or worse than the industry averages? Data table A B N 5 1 Thomas Department Stores, Inc. Income Statement Compared with Industry Average 3 For the Year Ended December 31 4 (amounts in thousands) Industry 5 Thomas Average 6 Sales revenues $ 784,000 100.0% 7 Less: Cost of goods sold 527,632 65.6% 8 Gross profit $ 256,368 34.4% 9 Less: Operating expenses 163,856 19.8% 10 Operating income 92,512 14.6% 11 Less: Interest expense 784 0.2% 12 Income before income taxes S 91,728 14.4% 13 Less: Income tax expense 7,056 0.7% 14 Net income $ 84,672 13.7% $ $ 1 Data table SOSTINSTV 4 4 (amounts in thousands) 5 Thomas Industry Average 6 Assets $ 324,000 70.8% 122,880 23.6% 7 Current assets 8 Fixed assets, net 9 Intangible assets, net 10 Other assets 9,120 0.9% 4.7% 24,000 480,000 11 Total assets $ 100.0% $ 48.3% 224,640 105,600 16.6% 12 Liabilities 13 Current liabilities 14 Long-term liabilities 15 Total liabilities 16 Stockholders' equity 17 Total common stockholders' equity $ 18 Total liabilities and equity $ $ 330,240 64.9% 35.1% 149,760 480,000 100.0%
Step by Step Solution
There are 3 Steps involved in it

Get step-by-step solutions from verified subject matter experts