

Question: please complete all questions, including the 2015 numbers for table. Financial statement analysis The financial statements of Zach Industries for the year ended December 31,

 please complete all questions, including the 2015 numbers for table.
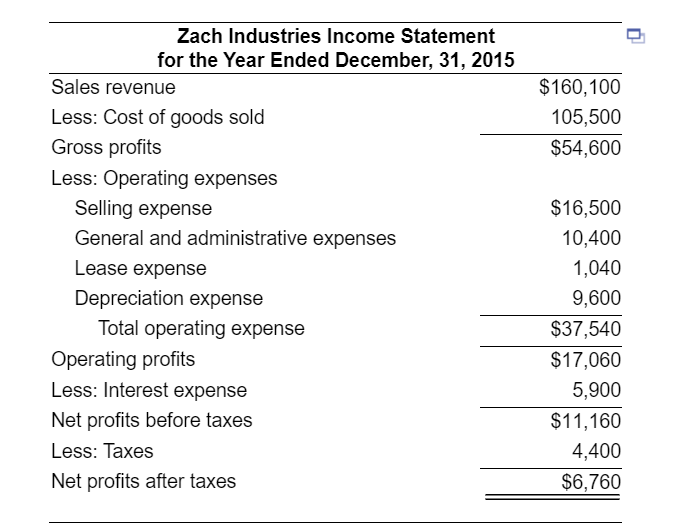
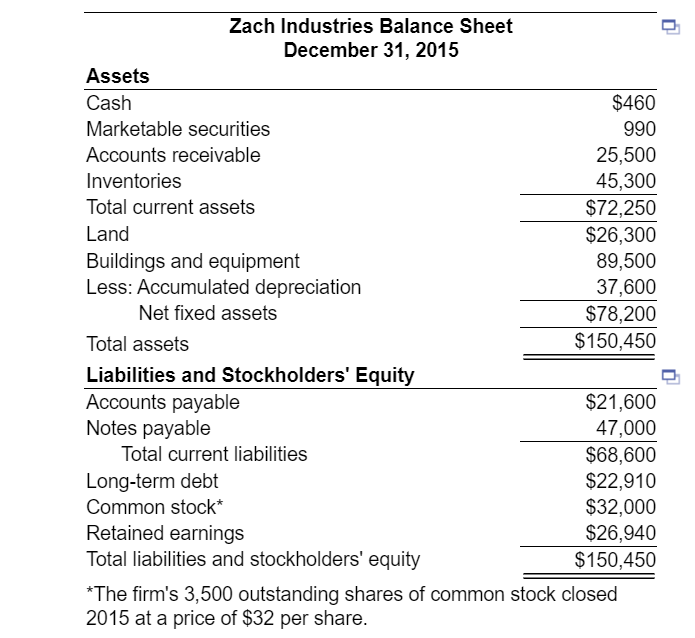
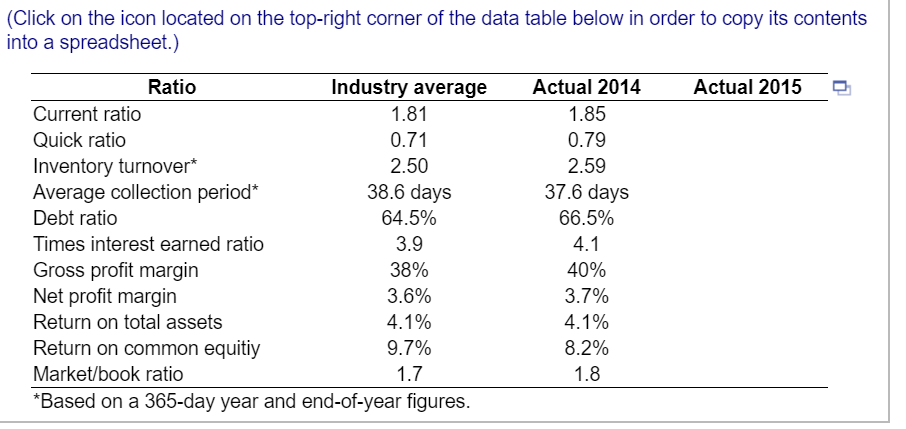
Financial statement analysis The financial statements of Zach Industries for the year ended December 31, 2015, follow : a. Use the financial statements to complete the following table Assume the industry averages given in the table are applicable for both 2014 and 2015. b. Analyze Zach Industries' financial condition as it is related to (1) liquidity, (2) activity, (3) debt, (4) profitability, and (5) market. Summarize the company's overall financial condition. $160,100 105,500 $54,600 Zach Industries Income Statement for the Year Ended December, 31, 2015 Sales revenue Less: Cost of goods sold Gross profits Less: Operating expenses Selling expense General and administrative expenses Lease expense Depreciation expense Total operating expense Operating profits Less: Interest expense Net profits before taxes Less: Taxes Net profits after taxes $16,500 10,400 1,040 9,600 $37,540 $17,060 5,900 $11,160 4,400 $6,760 Zach Industries Balance Sheet December 31, 2015 Assets Cash $460 Marketable securities 990 Accounts receivable 25,500 Inventories 45,300 Total current assets $72,250 Land $26,300 Buildings and equipment 89,500 Less: Accumulated depreciation 37,600 Net fixed assets $78,200 Total assets $150,450 Liabilities and Stockholders' Equity Accounts payable $21,600 Notes payable 47,000 Total current liabilities $68,600 Long-term debt $22,910 Common stock* $32,000 Retained earnings $26,940 Total liabilities and stockholders' equity $150,450 *The firm's 3,500 outstanding shares of common stock closed 2015 at a price of $32 per share. (Click on the icon located on the top-right corner of the data table below in order to copy its contents into a spreadsheet.) Actual 2015 Ratio Industry average Current ratio 1.81 Quick ratio 0.71 Inventory turnover* 2.50 Average collection period* 38.6 days Debt ratio 64.5% Times interest earned ratio 3.9 Gross profit margin 38% Net profit margin 3.6% Return on total assets 4.1% Return on common equitiy 9.7% Market/book ratio 1.7 *Based on a 365-day year and end-of-year figures. Actual 2014 1.85 0.79 2.59 37.6 days 66.5% 4.1 40% 3.7% 4.1% 8.2% 1.8
Step by Step Solution
There are 3 Steps involved in it

Get step-by-step solutions from verified subject matter experts