

Question: Please complete all tables and be as specific as possible. Thanks These two risk analysis charts are from a UC Davis study. The charts are
Please complete all tables and be as specific as possible. Thanks
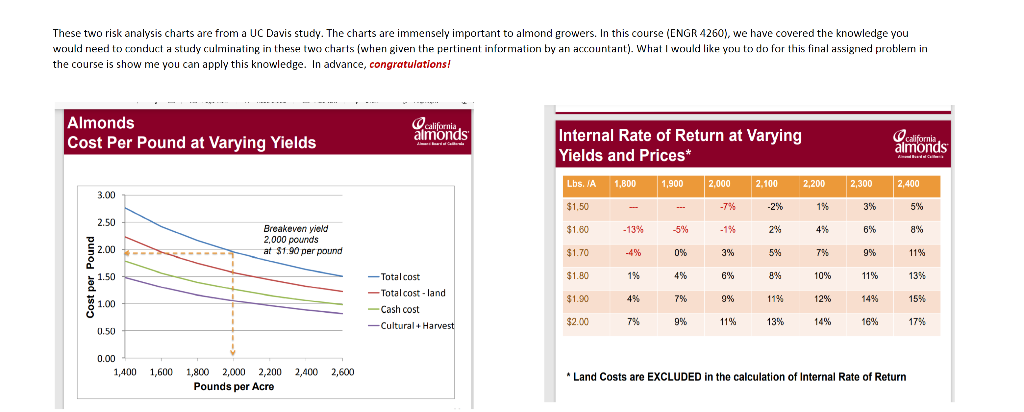
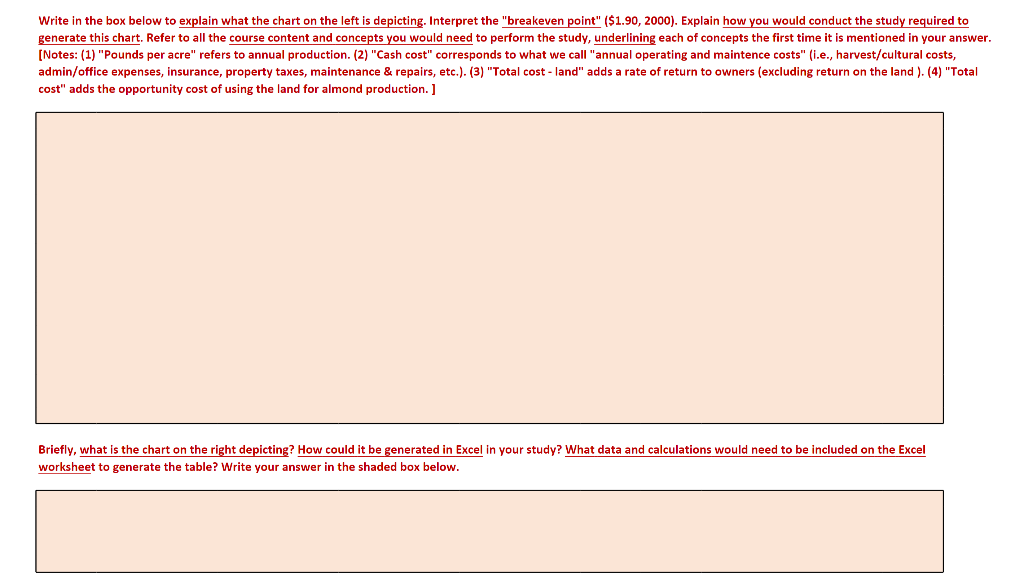
These two risk analysis charts are from a UC Davis study. The charts are immensely important to almond growers. In this course (ENGR 4260), we have covered the knowledge you would need to conduct a study culminating in these two charts (when given the pertinent information by an accountant). What I would like you to do for this final assigned problemi in the course is show me you can apply this knowledge. In advance, congratulations! Almonds Cost Per Pound at Varying Yields california almonds Internal Rate of Return at Varying Yields and Prices* diminea california almonds , Lbs. JA 1,800 1,900 2,000 2,100 2,200 2,300 2,400 3.00 $1.50 --- -7% -2% 1% 3% 5% 2.50 $1.60 -13% -5% -1% 2% 4% 6% 3% Pound Breakeven yield 2,000 pounds at $1.90 per pound 2.00 $1.70 $ 0% 3% 5% 7%% 9% 11% 1.50 $1.80 19% 4% 6% 8% 10% 11% 13% Cost per $1.90 4% 7% 9% 119 12% 14% 15% -Total cost -Total cost - land Cash cost - Cultural + Harvest 1.00 $2.00 7% 9% 11% 13% 16% 17% 0.50 0.00 1,400 1,600 1,800 2,000 2,200 2,400 2,600 Pounds per Acre * Land Costs are EXCLUDED in the calculation of Internal Rate of Return Write in the box below to explain what the chart on the left is depicting. Interpret the "breakeven point" ($1.90, 2000). Explain how you would conduct the study required to generate this chart. Refer to all the course content and concepts you would need to perform the study, underlining each of concepts the first time it is mentioned in your answer. [Notes: (1) "Pounds per acre" refers to annual production. (2) "Cash cost" corresponds to what we call "annual operating and maintence costs" (i.e., harvest/cultural costs, admin/office expenses, insurance, property taxes, maintenance & repairs, etc.). (3) "Total cost - land" adds a rate of return to owners (excluding return on the land ). (4) "Total cost" adds the opportunity cost of using the land for almond production. ] Briefly, what is the chart on the right depicting? How could it be generated in Excel in your study? What data and calculations would need to be included on the Excel worksheet to generate the table? Write your answer in the shaded box below. These two risk analysis charts are from a UC Davis study. The charts are immensely important to almond growers. In this course (ENGR 4260), we have covered the knowledge you would need to conduct a study culminating in these two charts (when given the pertinent information by an accountant). What I would like you to do for this final assigned problemi in the course is show me you can apply this knowledge. In advance, congratulations! Almonds Cost Per Pound at Varying Yields california almonds Internal Rate of Return at Varying Yields and Prices* diminea california almonds , Lbs. JA 1,800 1,900 2,000 2,100 2,200 2,300 2,400 3.00 $1.50 --- -7% -2% 1% 3% 5% 2.50 $1.60 -13% -5% -1% 2% 4% 6% 3% Pound Breakeven yield 2,000 pounds at $1.90 per pound 2.00 $1.70 $ 0% 3% 5% 7%% 9% 11% 1.50 $1.80 19% 4% 6% 8% 10% 11% 13% Cost per $1.90 4% 7% 9% 119 12% 14% 15% -Total cost -Total cost - land Cash cost - Cultural + Harvest 1.00 $2.00 7% 9% 11% 13% 16% 17% 0.50 0.00 1,400 1,600 1,800 2,000 2,200 2,400 2,600 Pounds per Acre * Land Costs are EXCLUDED in the calculation of Internal Rate of Return Write in the box below to explain what the chart on the left is depicting. Interpret the "breakeven point" ($1.90, 2000). Explain how you would conduct the study required to generate this chart. Refer to all the course content and concepts you would need to perform the study, underlining each of concepts the first time it is mentioned in your answer. [Notes: (1) "Pounds per acre" refers to annual production. (2) "Cash cost" corresponds to what we call "annual operating and maintence costs" (i.e., harvest/cultural costs, admin/office expenses, insurance, property taxes, maintenance & repairs, etc.). (3) "Total cost - land" adds a rate of return to owners (excluding return on the land ). (4) "Total cost" adds the opportunity cost of using the land for almond production. ] Briefly, what is the chart on the right depicting? How could it be generated in Excel in your study? What data and calculations would need to be included on the Excel worksheet to generate the table? Write your answer in the shaded box below
Step by Step Solution
There are 3 Steps involved in it

Get step-by-step solutions from verified subject matter experts