

Question: Please complete each table and support your answer with explanations. Financial statements to extract figures for the solution. Liquidity Ratio 2019 2018 Current ratio Quick
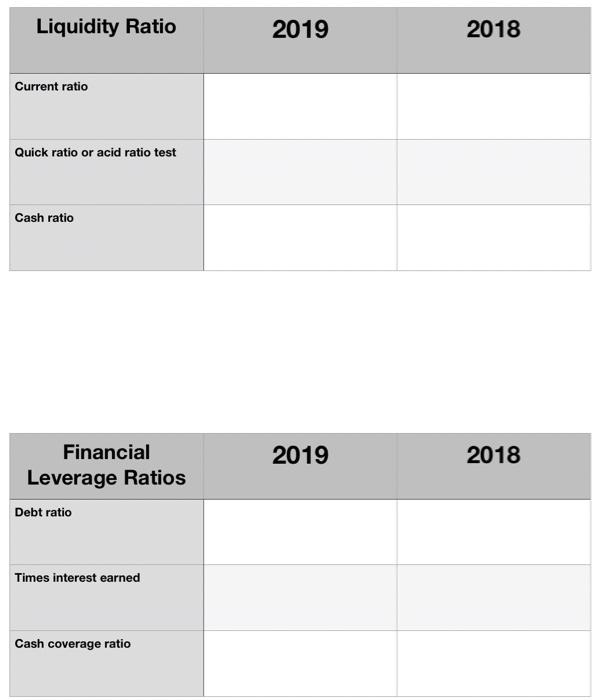
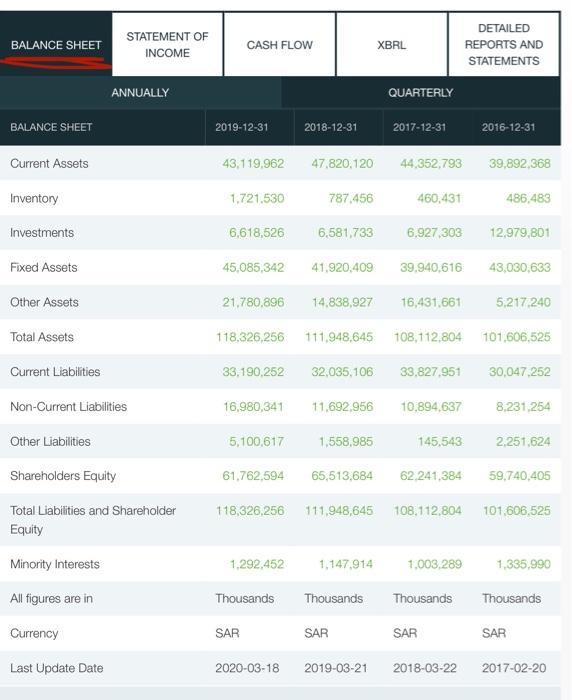
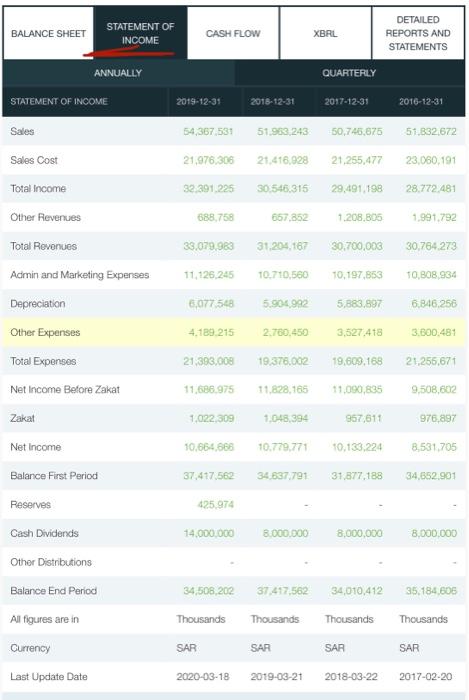
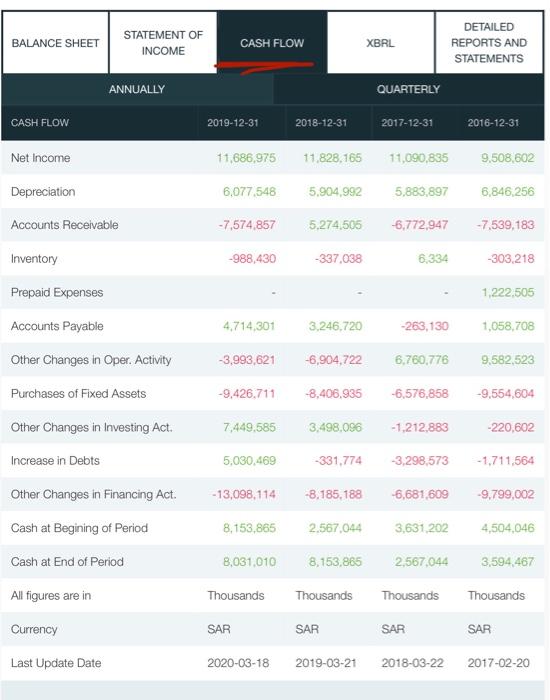
Liquidity Ratio 2019 2018 Current ratio Quick ratio or acid ratio test Cash ratio 2019 2018 Financial Leverage Ratios Debt ratio Times interest earned Cash coverage ratio BALANCE SHEET STATEMENT OF INCOME CASH FLOW XBRL DETAILED REPORTS AND STATEMENTS ANNUALLY QUARTERLY BALANCE SHEET 2019-12-31 2018-12-31 2017-12-31 2016-12-31 Current Assets 43.119,962 47,820,120 44,352,793 39,892,368 Inventory 1.721,530 787,456 460,431 486,483 Investments 6,618,526 6,581,733 6,927,303 12,979,801 Fixed Assets 45,085,342 41,920,409 39.940,616 43,030,633 Other Assets 21.780.896 14,838,927 16,431,661 5,217.240 Total Assets 118.326,256 111.948,645 108,112,804 101,606,525 Current Liabilities 33,190,252 32,035,106 33,827,951 30,047,252 Non-Current Liabilities 16,980,341 11,692,956 10,894,637 8,231,254 Other Liabilities 5,100,617 1.558,985 145,543 2,251,624 Shareholders Equity 61,762,594 65,513,684 62.241,384 59,740,405 118,326,256 111,948,645 108,112,804 101,606,525 Total Liabilities and Shareholder Equity Minority Interests 1,292,452 1,147,914 1,003,289 1,335,990 All figures are in Thousands Thousands Thousands Thousands Currency SAR SAR SAR SAR Last Update Date 2020-03-18 2019-03-21 2018-03-22 2017-02-20 BALANCE SHEET STATEMENT OF INCOME CASH FLOW XBRL DETAILED REPORTS AND STATEMENTS QUARTERLY ANNUALLY STATEMENT OF INCOME 2019-12-31 2018-12-31 2017-12-31 2016-12-31 54,367.531 51.963.243 50,745,875 51,832,672 Sales Sales Cost Total Income 21,976,306 21.416,928 21,255,477 23,060,191 32.391.225 30 546,315 29,491.198 28.772,481 Other Revenues 688,758 667,852 1.208.805 1.991,792 33,079,983 31,204.167 30,700,003 30,764.273 Total Revenues Admin and Marketing Expenses 11,126,245 10.710.560 10,197,553 TO 808 934 Depreciation 6,077.548 5.904.992 5,883,897 6.846,256 4.189.215 2.760,450 3,527.418 3.000.481 21.393,008 19.376.002 19,609,168 21,256,671 Other Expenses Total Expenses Net Income Before Zakat Zakat 11.828,165 11,090,835 9,508,602 11.686.975 1,022,309 1,048,394 967,611 976,897 Net Income 10,664,888 10.779,771 10.133.224 8.531.705 37,417,562 34 637,791 31,877,188 34,652.901 Balance First Period Reserves 425974 14,000,000 8.000.000 8,000,000 8,000,000 Cash Dividends Other Distributions 34,508,202 37.47,562 34,010,412 Balance End Period Al figures are in 35,184.606 Thousands Thousands Thousands Thousands Currency SAR SAR SAR SAR Last Update Date 2020-03-18 2019-03-21 2018-03-22 2017-02-20 BALANCE SHEET STATEMENT OF INCOME CASH FLOW XBRL DETAILED REPORTS AND STATEMENTS ANNUALLY QUARTERLY CASH FLOW 2019-12-31 2018-12-31 2017-12-31 2016-12-31 Net Income 11,686,975 11,828,165 11,090,835 9.508,602 6,077,548 5,904,992 5,883,897 6,846,256 Depreciation Accounts Receivable -7,574,857 5,274,505 -6,772,947 -7,539,183 Inventory -988.430 -337,038 6.334 -303.218 Prepaid Expenses 1,222,505 Accounts Payable 4,714,301 3.246.720 -263,130 1,058,708 Other Changes in Oper. Activity -3,993,621 -6,904,722 6,760,776 9,582,523 Purchases of Fixed Assets -9,426,711 -8,406,935 -6,576,858 -9,554,604 Other Changes in Investing Act. 7,449,585 3,498,096 -1,212,883 -220,602 Increase in Debts 5,030,469 -331,774 -3,298,573 -1,711,564 Other Changes in Financing Act. -13,098,114 -8,185,188 -6,681,609 -9,799,002 Cash at Begining of Period 8,153,865 2.567,044 3,631,202 4,504,046 Cash at End of Period 8,031,010 8.153,865 2,567,044 3,594,467 All figures are in Thousands Thousands Thousands Thousands SAR Currency SAR SAR SAR Last Update Date 2020-03-18 2019-03-21 2018-03-22 2017-02-20
Step by Step Solution
There are 3 Steps involved in it

Get step-by-step solutions from verified subject matter experts