

Question: please complete in table format. thanks 1. A known weight of dry soil (50 g of prepared dried, crushed & sieved) fine-grained sample into a
please complete in table format. thanks
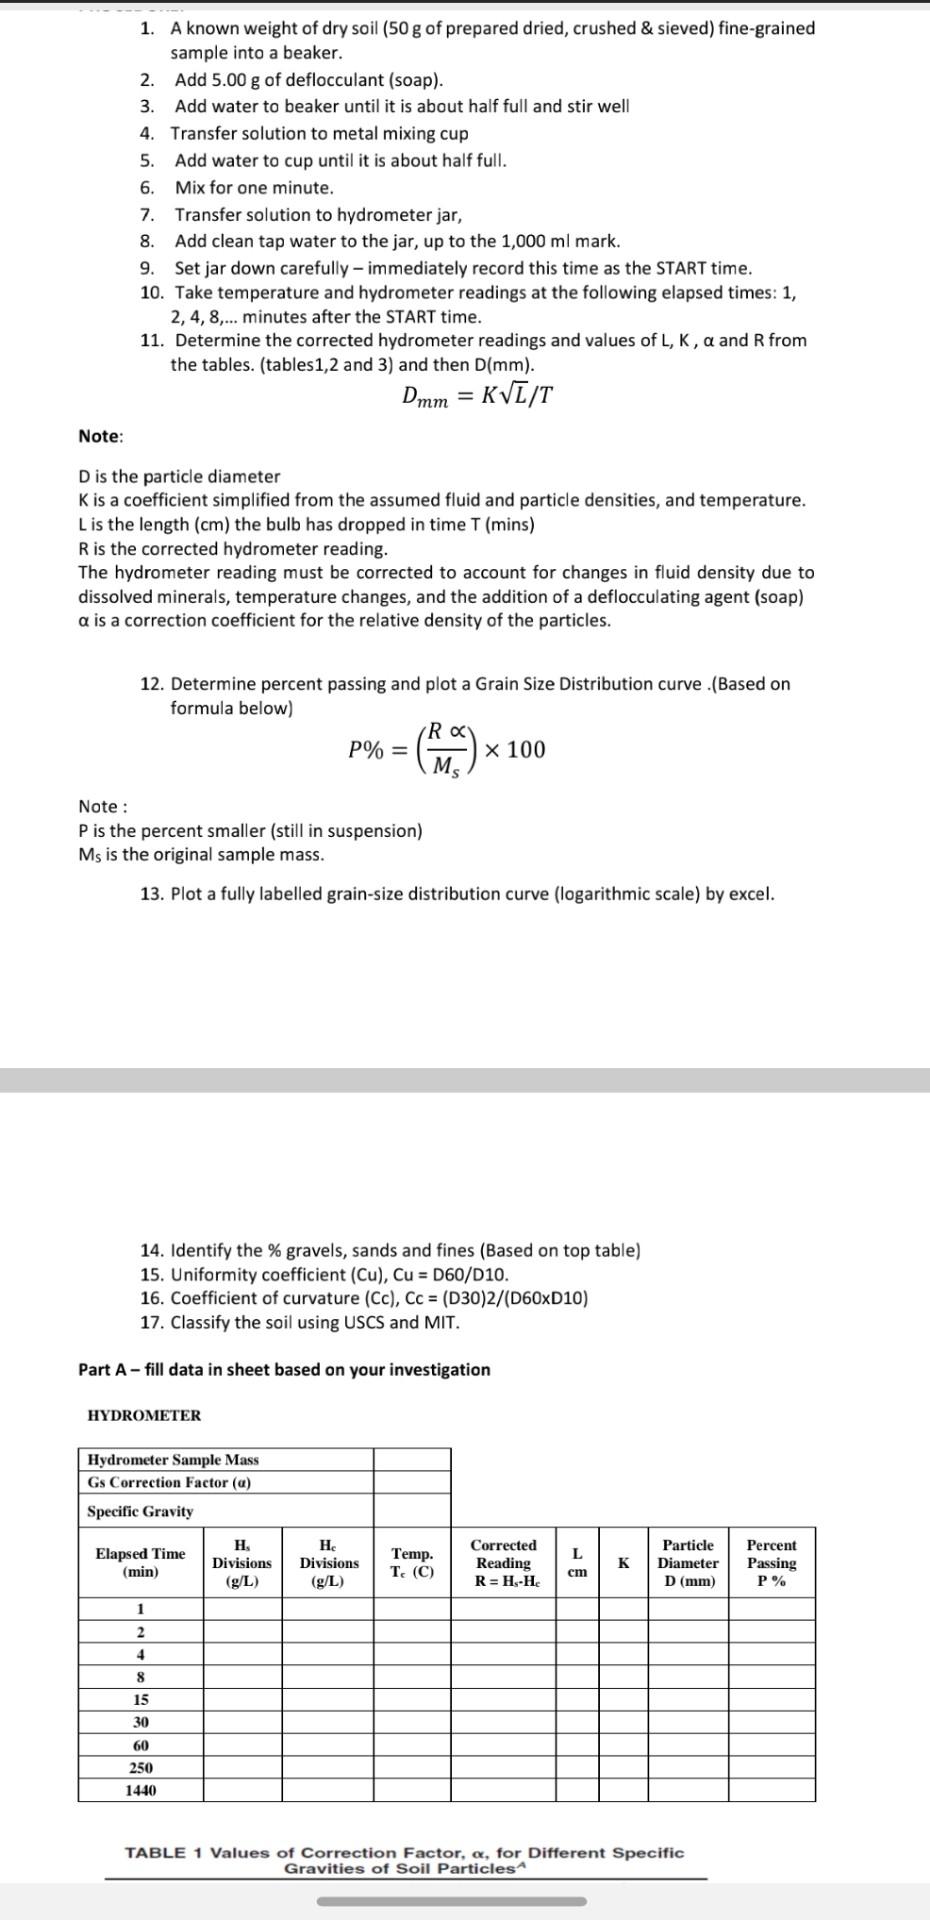
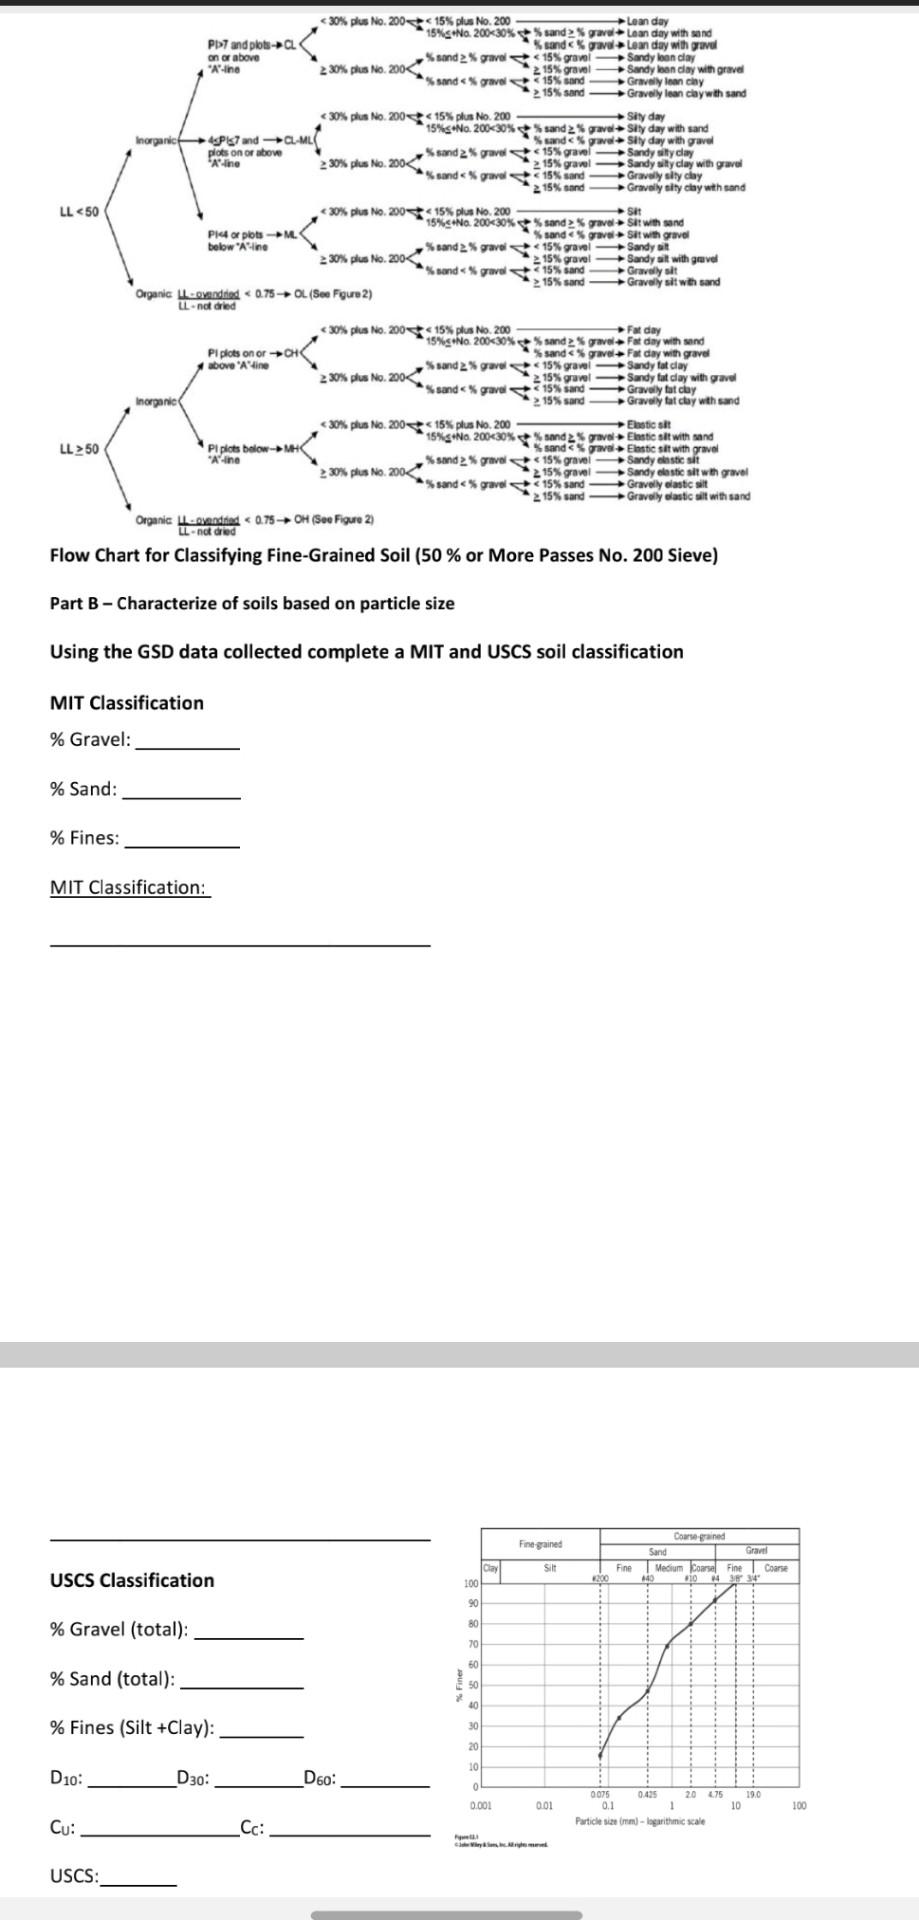
1. A known weight of dry soil (50 g of prepared dried, crushed & sieved) fine-grained sample into a beaker. 2. Add 5.00 g of deflocculant (soap). 3. Add water to beaker until it is about half full and stir well 4. Transfer solution to metal mixing cup 5. Add water to cup until it is about half full. 6. Mix for one minute. 7. Transfer solution to hydrometer jar, 8. Add clean tap water to the jar, up to the 1,000 ml mark. 9. Set jar down carefully immediately record this time as the START time. 10. Take temperature and hydrometer readings at the following elapsed times: 1, 2, 4, 8,... minutes after the START time. 11. Determine the corrected hydrometer readings and values of L, K, a and R from the tables. (tables1,2 and 3) and then D(mm). Dmm = KVI/T Note: D is the particle diameter K is a coefficient simplified from the assumed fluid and particle densities, and temperature. Lis the length (cm) the bulb has dropped in time T (mins) R is the corrected hydrometer reading. The hydrometer reading must be corrected to account for changes in fluid density due to dissolved minerals, temperature changes, and the addition of a deflocculating agent (soap) a is a correction coefficient for the relative density of the particles. 12. Determine percent passing and plot a Grain Size Distribution curve .(Based on formula below) R P% = x 100 MS Note : P is the percent smaller (still in suspension) Ms is the original sample mass. 13. Plot a fully labelled grain-size distribution curve (logarithmic scale) by excel. 14. Identify the % gravels, sands and fines (Based on top table) 15. Uniformity coefficient (Cu), Cu = D60/D10. 16. Coefficient of curvature (Cc), Cc = (D30)2/(D60xD10) 17. Classify the soil using USCS and MIT. Part A-fill data in sheet based on your investigation HYDROMETER Hydrometer Sample Mass Gs Correction Factor (a) Specific Gravity Elapsed Time (min) H. Divisions (g/L) H. Divisions (g/L) Temp. T. (C) Corrected Reading R=H.-H. L cm K Particle Diameter D (mm) Percent Passing P% 1 2 4 8 15 30 60 250 1440 TABLE 1 Values of Correction Factor, a, for Different Specific Gravities of Soil Particles 15% sand Gravely lean clay with sand 50 Flow Chart for Classifying Fine-Grained Soil (50 % or More Passes No. 200 Sieve) Part B - Characterize of soils based on particle size Using the GSD data collected complete a MIT and USCS soil classification MIT Classification % Gravel: % Sand: % Fines: MIT Classification: Fine gained Coarse grained Sand Gravel Medium Coarsel Fine Coarse 140 1104 Silt Fine USCS Classification 200 100 90 80 % Gravel (total): 70 % Sand (total): 50 50 2 10 % Fines (Silt +Clay): 30 20 10 D10: D30: D60: 19.0 0.001 0.01 0075 0.425 20 75 0.1 1 Particle simogarithmic sale 10 100 Cu: Cc: USCS: 1. A known weight of dry soil (50 g of prepared dried, crushed & sieved) fine-grained sample into a beaker. 2. Add 5.00 g of deflocculant (soap). 3. Add water to beaker until it is about half full and stir well 4. Transfer solution to metal mixing cup 5. Add water to cup until it is about half full. 6. Mix for one minute. 7. Transfer solution to hydrometer jar, 8. Add clean tap water to the jar, up to the 1,000 ml mark. 9. Set jar down carefully immediately record this time as the START time. 10. Take temperature and hydrometer readings at the following elapsed times: 1, 2, 4, 8,... minutes after the START time. 11. Determine the corrected hydrometer readings and values of L, K, a and R from the tables. (tables1,2 and 3) and then D(mm). Dmm = KVI/T Note: D is the particle diameter K is a coefficient simplified from the assumed fluid and particle densities, and temperature. Lis the length (cm) the bulb has dropped in time T (mins) R is the corrected hydrometer reading. The hydrometer reading must be corrected to account for changes in fluid density due to dissolved minerals, temperature changes, and the addition of a deflocculating agent (soap) a is a correction coefficient for the relative density of the particles. 12. Determine percent passing and plot a Grain Size Distribution curve .(Based on formula below) R P% = x 100 MS Note : P is the percent smaller (still in suspension) Ms is the original sample mass. 13. Plot a fully labelled grain-size distribution curve (logarithmic scale) by excel. 14. Identify the % gravels, sands and fines (Based on top table) 15. Uniformity coefficient (Cu), Cu = D60/D10. 16. Coefficient of curvature (Cc), Cc = (D30)2/(D60xD10) 17. Classify the soil using USCS and MIT. Part A-fill data in sheet based on your investigation HYDROMETER Hydrometer Sample Mass Gs Correction Factor (a) Specific Gravity Elapsed Time (min) H. Divisions (g/L) H. Divisions (g/L) Temp. T. (C) Corrected Reading R=H.-H. L cm K Particle Diameter D (mm) Percent Passing P% 1 2 4 8 15 30 60 250 1440 TABLE 1 Values of Correction Factor, a, for Different Specific Gravities of Soil Particles 15% sand Gravely lean clay with sand 50 Flow Chart for Classifying Fine-Grained Soil (50 % or More Passes No. 200 Sieve) Part B - Characterize of soils based on particle size Using the GSD data collected complete a MIT and USCS soil classification MIT Classification % Gravel: % Sand: % Fines: MIT Classification: Fine gained Coarse grained Sand Gravel Medium Coarsel Fine Coarse 140 1104 Silt Fine USCS Classification 200 100 90 80 % Gravel (total): 70 % Sand (total): 50 50 2 10 % Fines (Silt +Clay): 30 20 10 D10: D30: D60: 19.0 0.001 0.01 0075 0.425 20 75 0.1 1 Particle simogarithmic sale 10 100 Cu: Cc: USCS
Step by Step Solution
There are 3 Steps involved in it

Get step-by-step solutions from verified subject matter experts