

Question: please complete Powerful Tools Inc. Income Statement For the Year Ended December 31, 2017 2017 714,286 500,000 214,286 32,143 182,143 98,810 83,333 33,333 50,000 Sales
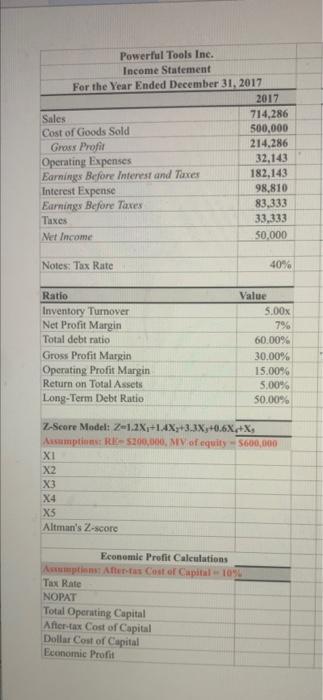
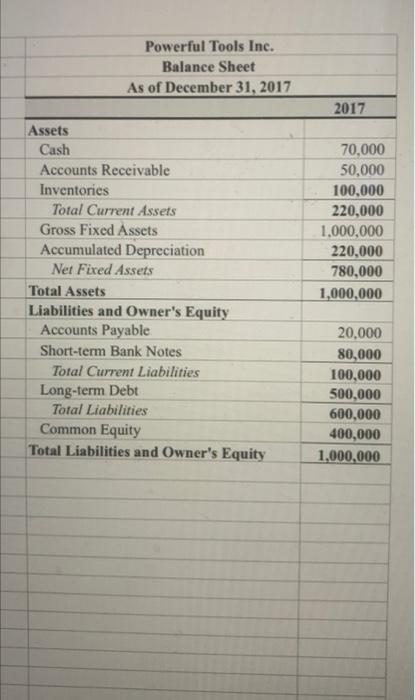
Powerful Tools Inc. Income Statement For the Year Ended December 31, 2017 2017 714,286 500,000 214,286 32,143 182,143 98,810 83,333 33,333 50,000 Sales Cost of Goods Sold Gross Profit Operating Expenses Earnings Before Interest and Taxes Interest Expense Earnings Before Taxes Taxes Net Income Notes: Tax Rate 40% Ratio 5.00x Inventory Turnover Net Profit Margin Total debt ratio 7% 60.00% Gross Profit Margin 30.00% Operating Profit Margin 15.00 % Return on Total Assets 5.00% Long-Term Debt Ratio 50.00% Z-Score Model: Z-1.2X+1.4X+3.3X+0.6X+Xs Assumptions: RE-$200,000, MV of equity-$600,000 XI X2 X3 X4 X5 Altman's Z-score Economic Profit Calculations Assumptions: After-tax Cost of Capital -10% Tax Rate NOPAT Total Operating Capital After-tax Cost of Capital Dollar Cost of Capital Economic Profit Value Powerful Tools Inc. Balance Sheet As of December 31, 2017 Assets Cash Accounts Receivable Inventories Total Current Assets Gross Fixed Assets Accumulated Depreciation Net Fixed Assets Total Assets Liabilities and Owner's Equity Accounts Payable Short-term Bank Notes Total Current Liabilities Long-term Debt Total Liabilities Common Equity Total Liabilities and Owner's Equity 2017 70,000 50,000 100,000 220,000 1,000,000 220,000 780,000 1,000,000 20,000 80,000 100,000 500,000 600,000 400,000 1,000,000
Step by Step Solution
There are 3 Steps involved in it

Get step-by-step solutions from verified subject matter experts