

Question: Please complete problem #s 4-10,4-11,&4-12on page. : 4-10 The operations manager of a musical instrument distributor feels that demand for a particular type of guitar
Please complete problem #s 4-10,4-11,&4-12on page.
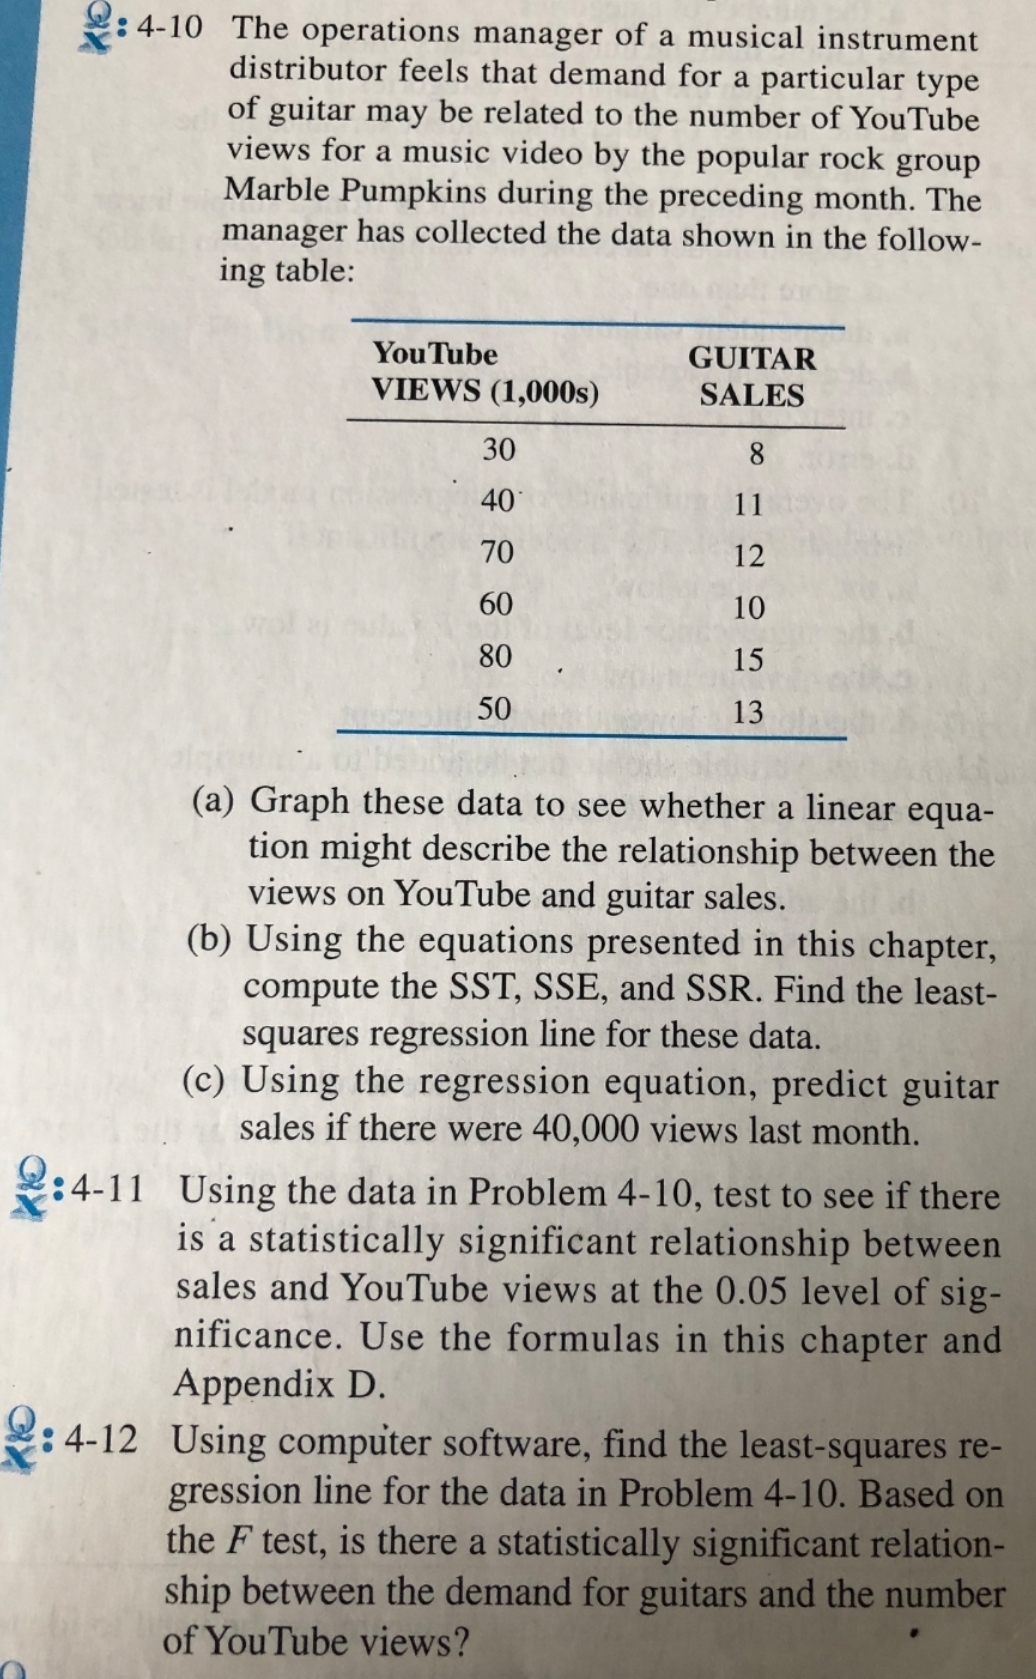
: 4-10 The operations manager of a musical instrument distributor feels that demand for a particular type of guitar may be related to the number of You Tube views for a music video by the popular rock group Marble Pumpkins during the preceding month. The manager has collected the data shown in the follow- ing table: You Tube GUITAR VIEWS (1,000s) SALES 30 8 40 11 70 12 60 10 80 15 50 13 (a) Graph these data to see whether a linear equa- tion might describe the relationship between the views on YouTube and guitar sales. (b) Using the equations presented in this chapter, compute the SST, SSE, and SSR. Find the least- squares regression line for these data. (c) Using the regression equation, predict guitar sales if there were 40,000 views last month. 2:4-11 Using the data in Problem 4-10, test to see if there is a statistically significant relationship between sales and YouTube views at the 0.05 level of sig- nificance. Use the formulas in this chapter and Appendix D. : 4-12 Using computer software, find the least-squares re- gression line for the data in Problem 4-10. Based on the F test, is there a statistically significant relation- ship between the demand for guitars and the number of YouTube views
Step by Step Solution
There are 3 Steps involved in it

Get step-by-step solutions from verified subject matter experts