Question: Please complete question 2 and show what EXCEL formulas you used for this. Please do not just copy/paste an answer from another Chegg question as
Please complete question 2 and show what EXCEL formulas you used for this. Please do not just copy/paste an answer from another Chegg question as these are wrong.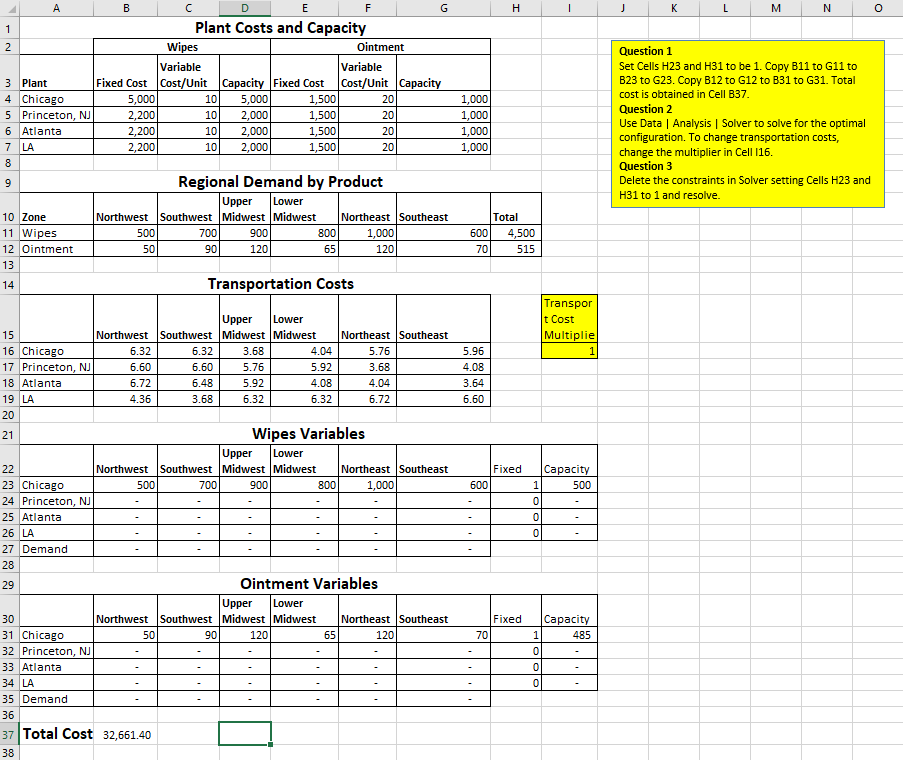
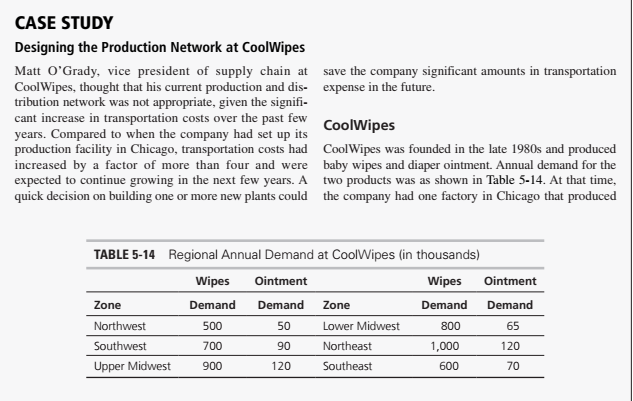
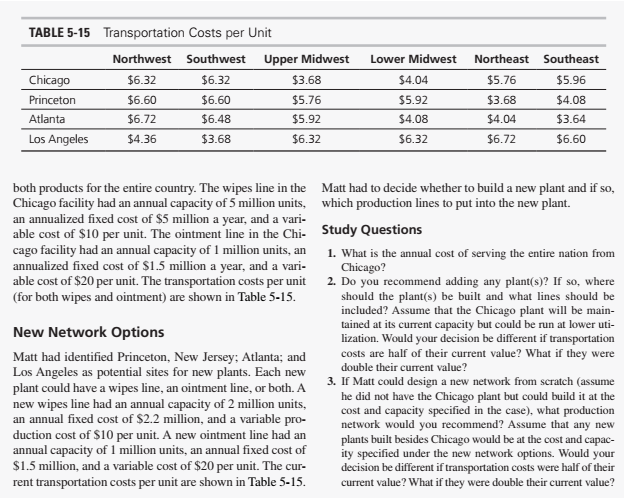
H J K L M N o B E F G 1 Plant Costs and Capacity 2 Wipes Ointment Variable Variable 3 Plant Fixed Cost Cost/Unit Capacity Fixed Cost Cost/Unit Capacity 4 Chicago 5,000 10 5,000 1,500 20 5 Princeton, NJ 2,200 10 2,000 1,500 20 6 Atlanta 2,200 10 2,000 1,500 20 7 LA 2,200 10 2,000 1,500 20 8 9 Regional Demand by Product Upper Lower 10 Zone Northwest Southwest Midwest Midwest Northeast Southeast 11 Wipes 500 700 900 800 1,000 12 Ointment 50 90 120 65 120 13 14 Transportation Costs 1,000 1,000 1,000 1,000 Question 1 Set Cells H23 and H31 to be 1. Copy B11 to G11 to B23 to G23. Copy B12 to G12 to B31 to G31. Total cost is obtained in Cell B37. Question 2 Use Data Analysis | Solver to solve for the optimal configuration. To change transportation costs, change the multiplier in Cell 116. Question 3 Delete the constraints in Solver setting Cells H23 and H31 to 1 and resolve. Total 600 4,500 70 515 Transpor t Cost Multiplie 1 5.96 4.08 3.64 6.60 Fixed 600 Upper Lower 15 Northwest Southwest Midwest Midwest Northeast Southeast 16 Chicago 6.32 6.32 3.68 4.04 5.76 17 Princeton, NJ 6.60 6.60 5.76 5.92 3.68 18 Atlanta 6.72 6.48 5.92 4.08 4.04 19 LA 4.36 3.68 6.32 6.32 6.72 20 21 Wipes Variables Upper Lower 22 Northwest Southwest Midwest Midwest Northeast Southeast 23 Chicago 500 700 900 800 1,000 24 Princeton, NJ 25 Atlanta 26 LA 27 Demand 28 29 Ointment Variables Upper Lower 30 Northwest Southwest Midwest Midwest Northeast Southeast 31 Chicago 50 90 120 65 120 32 Princeton, NJ 33 Atlanta 34 LA 35 Demand 36 37 Total Cost 32,661.40 38 Capacity 1 500 0 0 0 Fixed 70 | Capacity 1 485 0 0 0 CASE STUDY Designing the Production Network at Cool Wipes Matt O'Grady, vice president of supply chain at save the company significant amounts in transportation Cool Wipes, thought that his current production and dis- expense in the future. tribution network was not appropriate, given the signifi- cant increase in transportation costs over the past few Cool Wipes years. Compared to when the company had set up its production facility in Chicago, transportation costs had Cool Wipes was founded in the late 1980s and produced increased by a factor of more than four and were baby wipes and diaper ointment. Annual demand for the expected to continue growing in the next few years. A two products was as shown in Table 5-14. At that time, quick decision on building one or more new plants could the company had one factory in Chicago that produced TABLE 5-14 Regional Annual Demand at Cool Wipes (in thousands) Wipes Ointment Wipes Ointment Zone Demand Demand Zone Demand Demand Northwest 500 50 Lower Midwest 800 65 Southwest 700 90 Northeast 1,000 120 Upper Midwest 900 120 Southeast 600 70 Northeast Southeast $5.96 TABLE 5-15 Transportation Costs per Unit Northwest Southwest Upper Midwest Chicago $6.32 $6.32 $3.68 Princeton $6.60 $6.60 $5.76 Atlanta $6.72 $6.48 $5.92 Los Angeles $4.36 $3.68 $6.32 Lower Midwest $4.04 $5.92 $4.08 $5.76 $3.68 $4.04 $6.72 $4.08 $3.64 $6.32 $6.60 both products for the entire country. The wipes line in the Matt had to decide whether to build a new plant and if so, Chicago facility had an annual capacity of 5 million units, which production lines to put into the new plant. an annualized fixed cost of $5 million a year, and a vari- able cost of $10 per unit. The ointment line in the Chi- Study Questions cago facility had an annual capacity of 1 million units, an 1. What is the annual cost of serving the entire nation from annualized fixed cost of $1.5 million a year, and a vari- Chicago? able cost of $20 per unit. The transportation costs per unit 2. Do you recommend adding any plant(s)? If so, where (for both wipes and ointment) are shown in Table 5-15. should the plant(s) be built and what lines should be included? Assume that the Chicago plant will be main- New Network Options tained at its current capacity but could be run at lower uti- lization. Would your decision be different if transportation Matt had identified Princeton, New Jersey, Atlanta; and costs are half of their current value? What if they were Los Angeles as potential sites for new plants. Each new double their current value? plant could have a wipes line, an ointment line, or both. A 3. If Matt could design a new network from scratch (assume he did not have the Chicago plant but could build it at the new wipes line had an annual capacity of 2 million units, an annual fixed cost of $2.2 million, and a variable pro- cost and capacity specified in the case), what production network would you recommend? Assume that any new duction cost of $10 per unit. A new ointment line had an plants built besides Chicago would be at the cost and capac- annual capacity of 1 million units, an annual fixed cost of ity specified under the new network options. Would your $1.5 million, and a variable cost of $20 per unit. The cur- decision be different if transportation costs were half of their rent transportation costs per unit are shown in Table 5-15. current value? What if they were double their current value? H J K L M N o B E F G 1 Plant Costs and Capacity 2 Wipes Ointment Variable Variable 3 Plant Fixed Cost Cost/Unit Capacity Fixed Cost Cost/Unit Capacity 4 Chicago 5,000 10 5,000 1,500 20 5 Princeton, NJ 2,200 10 2,000 1,500 20 6 Atlanta 2,200 10 2,000 1,500 20 7 LA 2,200 10 2,000 1,500 20 8 9 Regional Demand by Product Upper Lower 10 Zone Northwest Southwest Midwest Midwest Northeast Southeast 11 Wipes 500 700 900 800 1,000 12 Ointment 50 90 120 65 120 13 14 Transportation Costs 1,000 1,000 1,000 1,000 Question 1 Set Cells H23 and H31 to be 1. Copy B11 to G11 to B23 to G23. Copy B12 to G12 to B31 to G31. Total cost is obtained in Cell B37. Question 2 Use Data Analysis | Solver to solve for the optimal configuration. To change transportation costs, change the multiplier in Cell 116. Question 3 Delete the constraints in Solver setting Cells H23 and H31 to 1 and resolve. Total 600 4,500 70 515 Transpor t Cost Multiplie 1 5.96 4.08 3.64 6.60 Fixed 600 Upper Lower 15 Northwest Southwest Midwest Midwest Northeast Southeast 16 Chicago 6.32 6.32 3.68 4.04 5.76 17 Princeton, NJ 6.60 6.60 5.76 5.92 3.68 18 Atlanta 6.72 6.48 5.92 4.08 4.04 19 LA 4.36 3.68 6.32 6.32 6.72 20 21 Wipes Variables Upper Lower 22 Northwest Southwest Midwest Midwest Northeast Southeast 23 Chicago 500 700 900 800 1,000 24 Princeton, NJ 25 Atlanta 26 LA 27 Demand 28 29 Ointment Variables Upper Lower 30 Northwest Southwest Midwest Midwest Northeast Southeast 31 Chicago 50 90 120 65 120 32 Princeton, NJ 33 Atlanta 34 LA 35 Demand 36 37 Total Cost 32,661.40 38 Capacity 1 500 0 0 0 Fixed 70 | Capacity 1 485 0 0 0 CASE STUDY Designing the Production Network at Cool Wipes Matt O'Grady, vice president of supply chain at save the company significant amounts in transportation Cool Wipes, thought that his current production and dis- expense in the future. tribution network was not appropriate, given the signifi- cant increase in transportation costs over the past few Cool Wipes years. Compared to when the company had set up its production facility in Chicago, transportation costs had Cool Wipes was founded in the late 1980s and produced increased by a factor of more than four and were baby wipes and diaper ointment. Annual demand for the expected to continue growing in the next few years. A two products was as shown in Table 5-14. At that time, quick decision on building one or more new plants could the company had one factory in Chicago that produced TABLE 5-14 Regional Annual Demand at Cool Wipes (in thousands) Wipes Ointment Wipes Ointment Zone Demand Demand Zone Demand Demand Northwest 500 50 Lower Midwest 800 65 Southwest 700 90 Northeast 1,000 120 Upper Midwest 900 120 Southeast 600 70 Northeast Southeast $5.96 TABLE 5-15 Transportation Costs per Unit Northwest Southwest Upper Midwest Chicago $6.32 $6.32 $3.68 Princeton $6.60 $6.60 $5.76 Atlanta $6.72 $6.48 $5.92 Los Angeles $4.36 $3.68 $6.32 Lower Midwest $4.04 $5.92 $4.08 $5.76 $3.68 $4.04 $6.72 $4.08 $3.64 $6.32 $6.60 both products for the entire country. The wipes line in the Matt had to decide whether to build a new plant and if so, Chicago facility had an annual capacity of 5 million units, which production lines to put into the new plant. an annualized fixed cost of $5 million a year, and a vari- able cost of $10 per unit. The ointment line in the Chi- Study Questions cago facility had an annual capacity of 1 million units, an 1. What is the annual cost of serving the entire nation from annualized fixed cost of $1.5 million a year, and a vari- Chicago? able cost of $20 per unit. The transportation costs per unit 2. Do you recommend adding any plant(s)? If so, where (for both wipes and ointment) are shown in Table 5-15. should the plant(s) be built and what lines should be included? Assume that the Chicago plant will be main- New Network Options tained at its current capacity but could be run at lower uti- lization. Would your decision be different if transportation Matt had identified Princeton, New Jersey, Atlanta; and costs are half of their current value? What if they were Los Angeles as potential sites for new plants. Each new double their current value? plant could have a wipes line, an ointment line, or both. A 3. If Matt could design a new network from scratch (assume he did not have the Chicago plant but could build it at the new wipes line had an annual capacity of 2 million units, an annual fixed cost of $2.2 million, and a variable pro- cost and capacity specified in the case), what production network would you recommend? Assume that any new duction cost of $10 per unit. A new ointment line had an plants built besides Chicago would be at the cost and capac- annual capacity of 1 million units, an annual fixed cost of ity specified under the new network options. Would your $1.5 million, and a variable cost of $20 per unit. The cur- decision be different if transportation costs were half of their rent transportation costs per unit are shown in Table 5-15. current value? What if they were double their current value


