

Question: please complete question 6 and explain the steps. also draw the graph and answer the questions below table and shwoing the calculations 6. Construct a
please complete question 6 and explain the steps. also draw the graph and answer the questions below table and shwoing the calculations 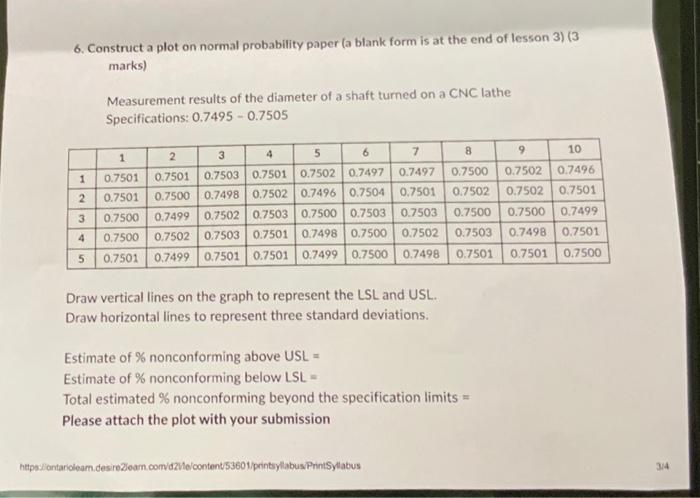
6. Construct a plot on normal probability paper (a blank form is at the end of lesson 3) (3 marks) Measurement results of the diameter of a shaft turned on a CNC lathe Specifications: 0.74950.7505 Draw vertical lines on the graph to represent the LSL and USL. Draw horizontal lines to represent three standard deviations. Estimate of % nonconforming above USL = Estimate of % nonconforming below LSL = Total estimated % nonconforming beyond the specification limits = Please attach the plot with your submission
Step by Step Solution
There are 3 Steps involved in it
1 Expert Approved Answer
Step: 1 Unlock

Question Has Been Solved by an Expert!
Get step-by-step solutions from verified subject matter experts
Step: 2 Unlock
Step: 3 Unlock