

Question: please complete questions information for questions attached as well Experiment No. 6: PID Control of Liquid Level Worksheet What is the primary purpose of derivatuction/Theory
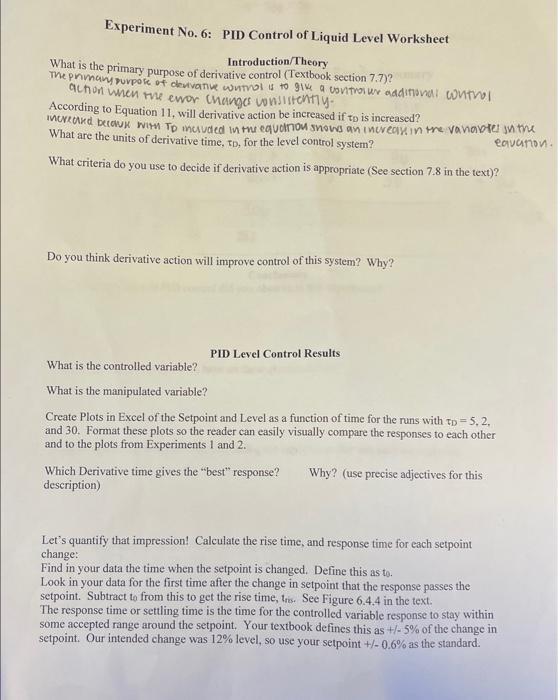
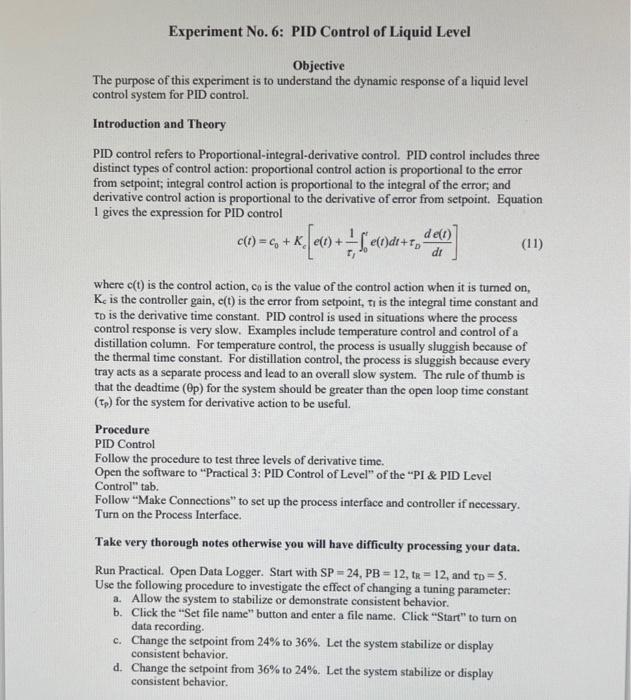
Experiment No. 6: PID Control of Liquid Level Worksheet What is the primary purpose of derivatuction/Theory The phimam purpore of clemvan derivative control (Textbook section 7.7)? qction when the emor che whinol is to gik a uontroi un addifoud whthol According to Equation 11, will derivative action be increased if to is increased? increakd becouk witn TD mesuded in the equolnou snows an inereaked in the va nabtel in the What are the units of derivative time, D, for the level control system? eavarion What criteria do you use to decide if derivative action is appropriate (See section 7.8 in the text)? Do you think derivative action will improve control of this system? Why? PID Level Control Results What is the controlled variable? What is the manipulated variable? Create Plots in Excel of the Setpoint and Level as a function of time for the runs with D=5,2, and 30 . Format these plots so the reader can easily visually compare the responses to each other and to the plots from Experiments 1 and 2. Which Derivative time gives the "best" response? Why? (use precise adjectives for this description) Let's quantify that impression! Calculate the rise time, and response time for each setpoint change: Find in your data the time when the setpoint is changed. Define this as to. Look in your data for the first time after the change in setpoint that the response passes the setpoint. Subtract to from this to get the rise time, tis. See Figure 6.4 .4 in the text. The response time or settling time is the time for the controlled variable response to stay within some accepted range around the setpoint. Your textbook defines this as +/25% of the change in setpoint. Our intended change was 12% level, so use your setpoint +/0.6% as the standard. Experiment No. 6: PID Control of Liquid Level Objective The purpose of this experiment is to understand the dynamic response of a liquid level control system for PID control. Introduction and Theory PID control refers to Proportional-integral-derivative control. PID control includes three distinct types of control action: proportional control action is proportional to the error from setpoint; integral control action is proportional to the integral of the error; and derivative control action is proportional to the derivative of error from setpoint. Equation 1 gives the expression for PID control c(t)=c0+Ke[e(t)+r110te(t)dt+rDdtde(t)] where c(t) is the control action, c0 is the value of the control action when it is tumed on, Kc is the controller gain, e(t) is the error from setpoint, t is the integral time constant and tD is the derivative time constant. PID control is used in situations where the process control response is very slow. Examples include temperature control and control of a distillation column. For temperature control, the process is usually sluggish because of the thermal time constant. For distillation control, the process is sluggish because every tray acts as a separate process and lead to an overall slow system. The rule of thumb is that the deadtime (p) for the system should be greater than the open loop time constant (p) for the system for derivative action to be useful. Procedure PID Control Follow the procedure to test three levels of derivative time. Open the software to "Practical 3: PID Control of Level" of the "PI \& PID Level Control" tab. Follow "Make Connections" to set up the process interface and controller if necessary. Turn on the Process Interface. Take very thorough notes otherwise you will have difficulty processing your data. Run Practical. Open Data Logger. Start with SP=24,PB=12,tR=12, and tD=5. Use the following procedure to investigate the effect of changing a tuning parameter: a. Allow the system to stabilize or demonstrate consistent behavior. b. Click the "Set file name" button and enter a file name. Click "Start" to turn on data recording. c. Change the setpoint from 24% to 36%. Let the system stabilize or display consistent behavior. d. Change the setpoint from 36% to 24%. Let the system stabilize or display consistent behavior. e. Tum off data recording by clicking "Stop". The system records 2 points per second. Repeat this procedure to get a replacement run if there appears to be a problem (changing setpoints, noisy signal, valve freezes, etc.). Change to tD=2 and repeat the process. Change to to =20 and repeat the process. Specific Report Requirements - What are the manipulated and controlled variables? - How does PID control compare to the PI control from the last experiment
Step by Step Solution
There are 3 Steps involved in it

Get step-by-step solutions from verified subject matter experts