

Question: Please complete the following activities using Excel and the workbook you created in Part I of this Course Project ( add a worksheet to the
Please complete the following activities using Excel and the workbook you created in Part I of this Course Project add a worksheet to the workbook titled Part III:
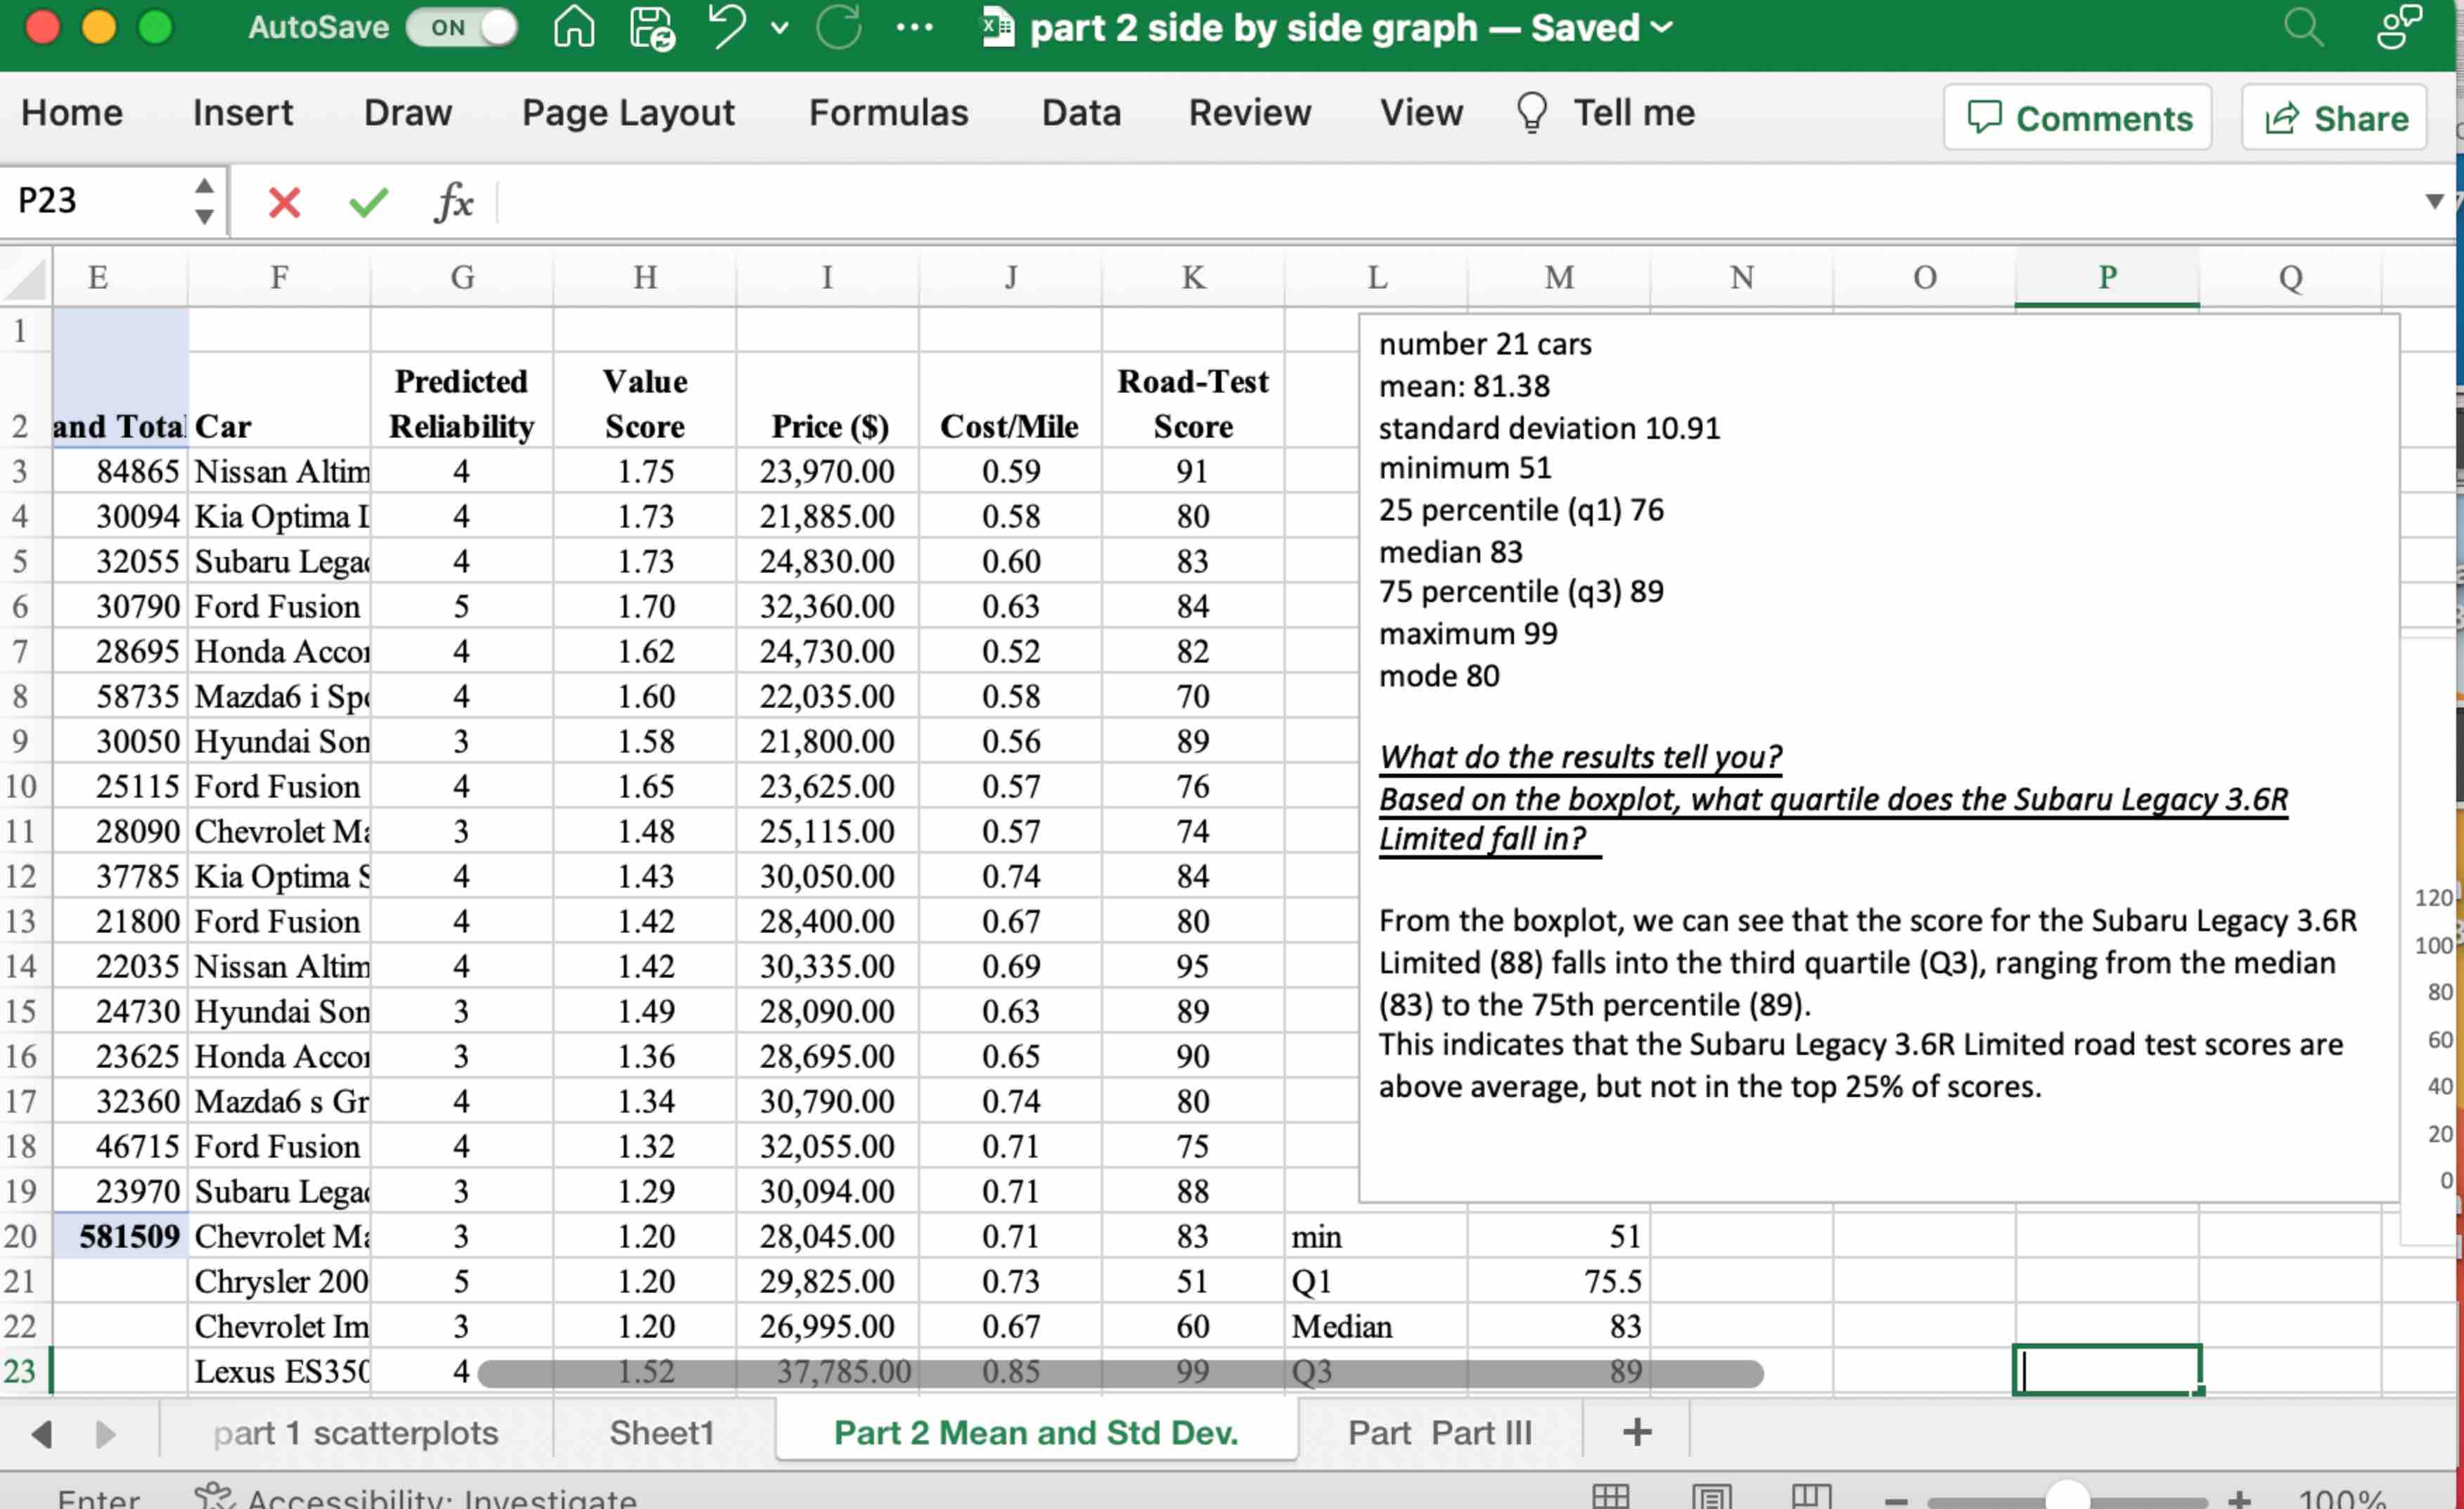
Using the measures of central tendency mean median, and mode and dispersion standard deviation explain the association between all the variables in this project.
What do you notice?
How are they related?
What do they tell you about the data?
Calculate the probability a car on the list will have a price less than $ Calculate the probability a car on the list will have a price greater than or equal to $
Use the normal distribution probability formula.
What are the upper and lower limits for Car Purchase Price with a confidence interval estimate? Be sure to format in currency.
See the Excel steps on page of the textbook for assistance.
What are the upper and lower limits for the Cost per Mile with a confidence interval.
See the Excel steps on page of the textbook for assistance.
Criteria for Success: Your responses should address the topics presented as thoroughly as possible. Collegelevel writing mechanics are required including spelling, sentence structure, capitalization, and punctuation.
This assessment requires the use of Excel and the submission of an Excel file. Please place all your answers in the Excel workbook and clearly mark all your answers. You should use Excel formulas where appropriate and show your work where formulas are not used.
Step by Step Solution
There are 3 Steps involved in it
1 Expert Approved Answer
Step: 1 Unlock

Question Has Been Solved by an Expert!
Get step-by-step solutions from verified subject matter experts
Step: 2 Unlock
Step: 3 Unlock