

Question: Please complete the following on the Employee Data table table [ [ , A , B , C , D , E , F
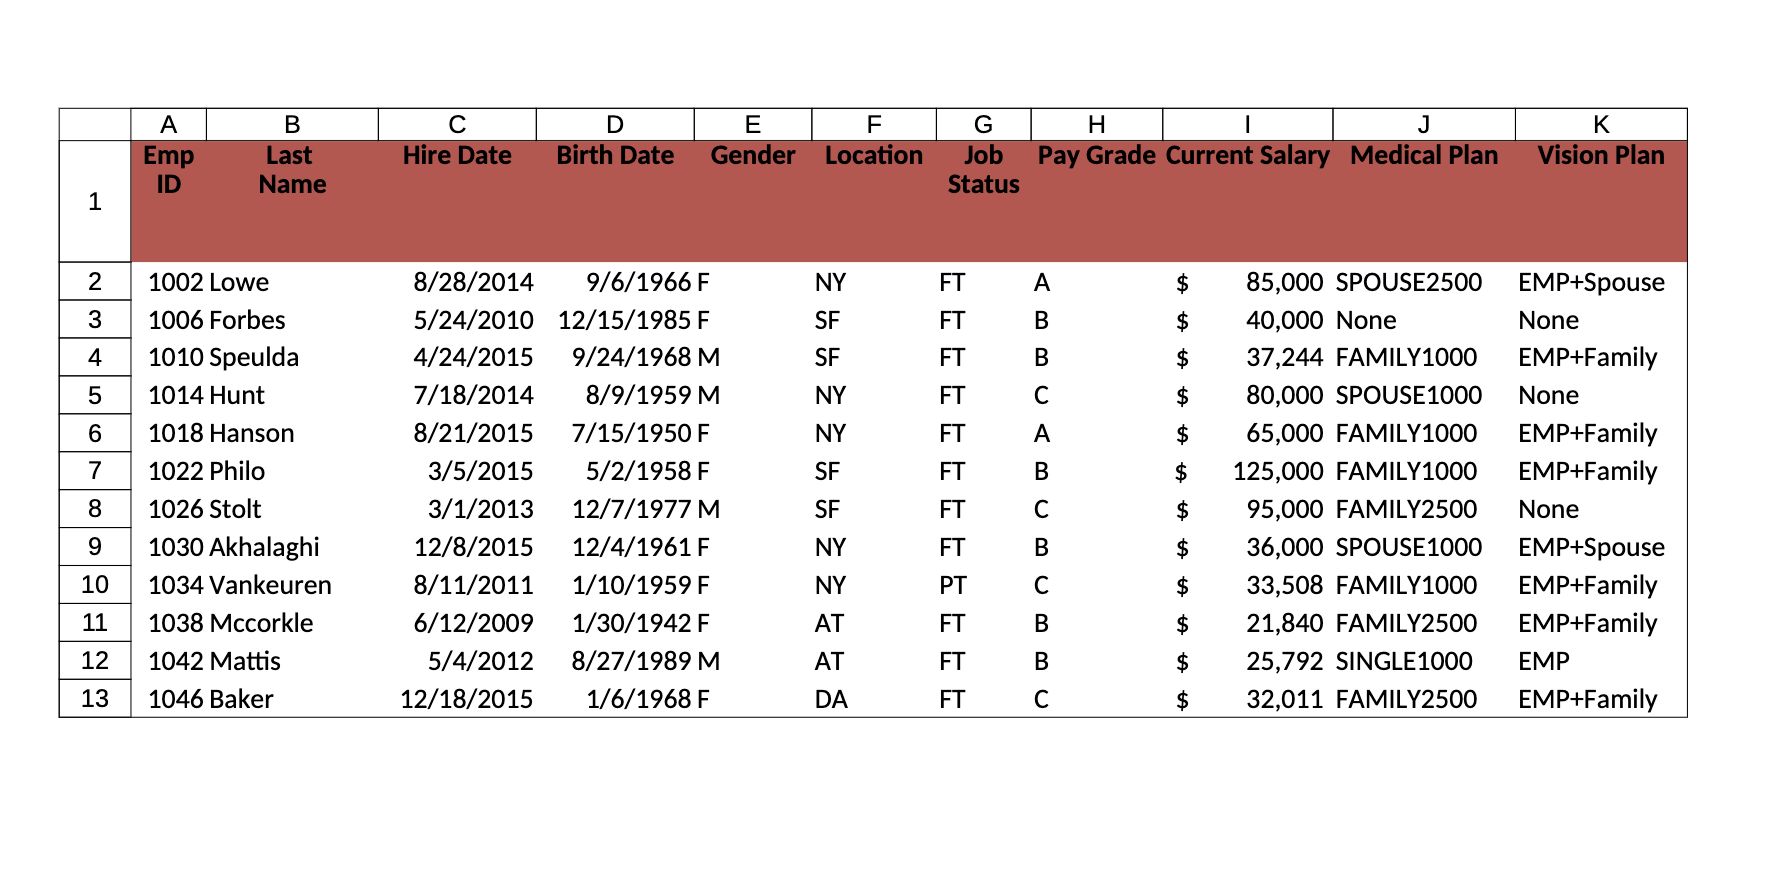
Please complete the following on the Employee Data table tableABCDEFGHI,JKtableEmpIDtableLastNameHire Date,Birth Date,Gender,Location,tableJobStatusPay Grade,Curren,nt Salary,Medical Plan,Vision Plan FNYFTA$SPOUSEEMPSpouseorbes, FSFFTB$None,Nonepeulda, MSFFTB$FAMILYEMPFamily MNYFTC$SPOUSENoneanson, FNYFTA$FAMILYEMPFamily FSFFTB$FAMILYEMPFamily MSFFTC$FAMILYNonekhalaghi, FNYFTB$SPOUSEEMPSpouseankeure
The K Max Contribution column is of the Current Salary for each person.
The Company Match column will be of the Current Salary for each person.
The Bonus Amount is based on the Years of Service. Use the vlookup.
The Salary Increase is for those who have worked or less years and for those
who have worked more than years. And yes, you get to use an IF function here!
Calculate the Medical Plan and Vision Plan Cost using a vlookup. Your input will be
column J and K respectively.
Make sure you calculate the Total Compensation which is the Current Salary plus all of
those things you just got done computing in columns N thru S
Add two new sheets. Copy the entire Employee Data sheet and paste it onto each of the two new
sheets you just created, naming the first sheet Sort and the second sheet Sort Complete the
following.
Sort the Sort sheet so that the reader can use the information better using one column of
your choice.
Sort the Sort sheet so that the reader can use the information better using two columns
of your choice.
Open up a Word document, saving it as Project
In the first paragraph, tell me which column you used to sort the Employee Data sheet
and why?
In the second paragraph, tell which columns you used to sort the Employee Data sheet
and why?
Go back to the Employee Data sheet and using the information from this sheet, create a Pivot
Table and Chart on a new sheet using the following.
Location, pay grade, the average current salary and the average total compensation
should be represented in the pivot table.
Create the pivot chart from the pay grade information from each location.
Copy both the pivot table and pivot chart to the Project Word document.
What is your initial reaction to the difference in average current salary and the average
total compensation, to the different locations and to the different pay grades?Please complete the following on the Employee Data table
The K Max Contribution column is of the Current Salary for each person.
The Company Match column will be of the Current Salary for each person.
The Bonus Amount is based on the Years of Service. Use the vlookup.
The Salary Increase is for those who have worked or less years and for those
who have worked more than years. And yes, you get to use an IF function here!
Calculate the Medical Plan and Vision Plan Cost using a vlookup. Your input will be
column and respectively.
Make sure you calculate the Total Compensation which is the Current Salary plus all of
those things you just got done computing in columns N thru S
Add two new sheets. Copy the entire Employee Data sheet and paste it onto each of the two new
sheets you just created, naming the first sheet Sort and the second sheet Sort Complete the
following.
Sort the Sort sheet so that the reader can use the information better using one column of
your choice.
Sort the Sort sheet so that the reader can use the information better using two columns
of your choice.
Open up a Word document, saving it as Project
In the first paragraph, tell me which column you used to sort the Employee Data sheet
and why?
In the second paragraph, tell which columns you used to sort the Employee Data sheet
and why?
Step by Step Solution
There are 3 Steps involved in it
1 Expert Approved Answer
Step: 1 Unlock

Question Has Been Solved by an Expert!
Get step-by-step solutions from verified subject matter experts
Step: 2 Unlock
Step: 3 Unlock