

Question: please complete the highlighted questions:) thank you STEP E - 25 points - TRICKY and Playing with the Tools Updating Now try to find the
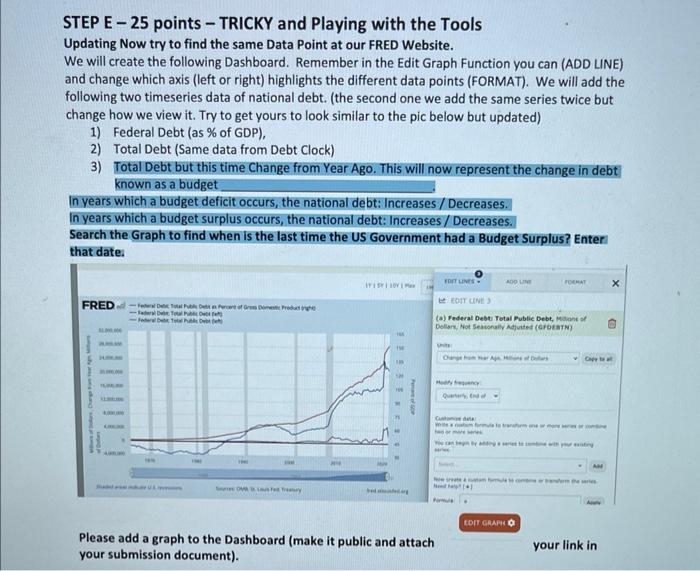
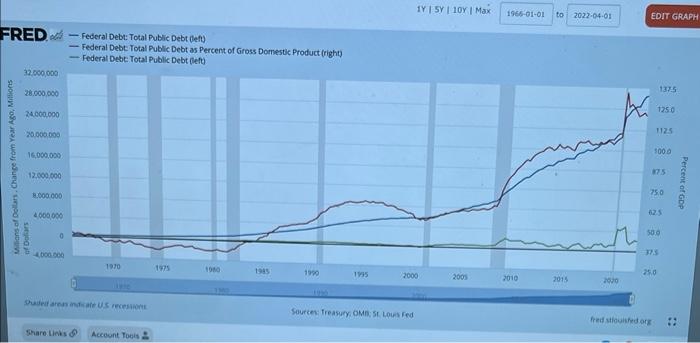
STEP E - 25 points - TRICKY and Playing with the Tools Updating Now try to find the same Data Point at our FRED Website. We will create the following Dashboard. Remember in the Edit Graph Function you can (ADD LINE) and change which axis (left or right) highlights the different data points (FORMAT). We will add the following two timeseries data of national debt. (the second one we add the same series twice but change how we view it. Try to get yours to look similar to the pic below but updated) 1) Federal Debt (as \% of GDP), 2) Total Debt (Same data from Debt Clock) 3) Total Debt but this time Change from Year Ago. This will now represent the change in debt known as a budget In years which a budget deficit occurs, the national debt: Increases / Decreases. In years which a budget surplus occurs, the national debt: Increases / Decreases. Search the Graph to find when is the last time the US Government had a Budget Surplus? Enter: that date: Please add a graph to the Dashboard (make it public and attach your link in your submission document). STEP E - 25 points - TRICKY and Playing with the Tools Updating Now try to find the same Data Point at our FRED Website. We will create the following Dashboard. Remember in the Edit Graph Function you can (ADD LINE) and change which axis (left or right) highlights the different data points (FORMAT). We will add the following two timeseries data of national debt. (the second one we add the same series twice but change how we view it. Try to get yours to look similar to the pic below but updated) 1) Federal Debt (as \% of GDP), 2) Total Debt (Same data from Debt Clock) 3) Total Debt but this time Change from Year Ago. This will now represent the change in debt known as a budget In years which a budget deficit occurs, the national debt: Increases / Decreases. In years which a budget surplus occurs, the national debt: Increases / Decreases. Search the Graph to find when is the last time the US Government had a Budget Surplus? Enter: that date: Please add a graph to the Dashboard (make it public and attach your link in your submission document)
Step by Step Solution
There are 3 Steps involved in it

Get step-by-step solutions from verified subject matter experts