

Question: Please complete the ratio analysis spreadsheet 13 MODULE III: FINANCIAL ANALYSIS INTRODUCTION of financial analysis is to evaluate a firm's past, present, and future financial
 Please complete the ratio analysis spreadsheet
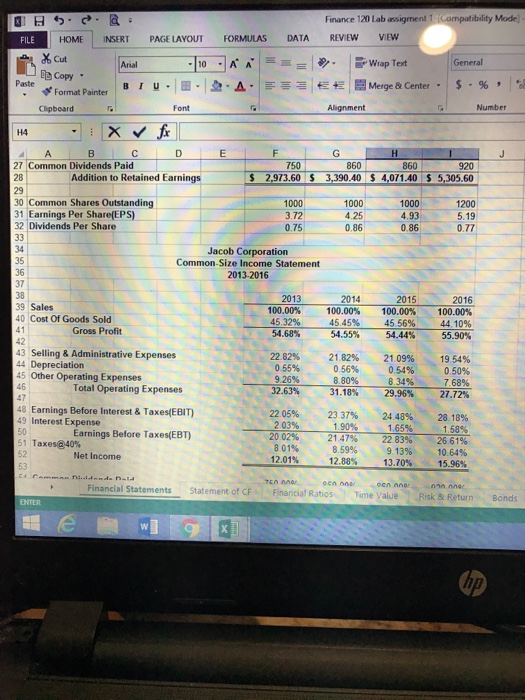
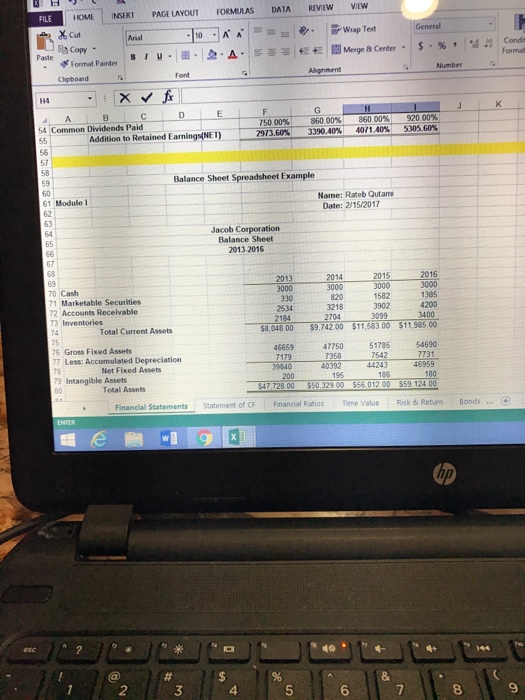
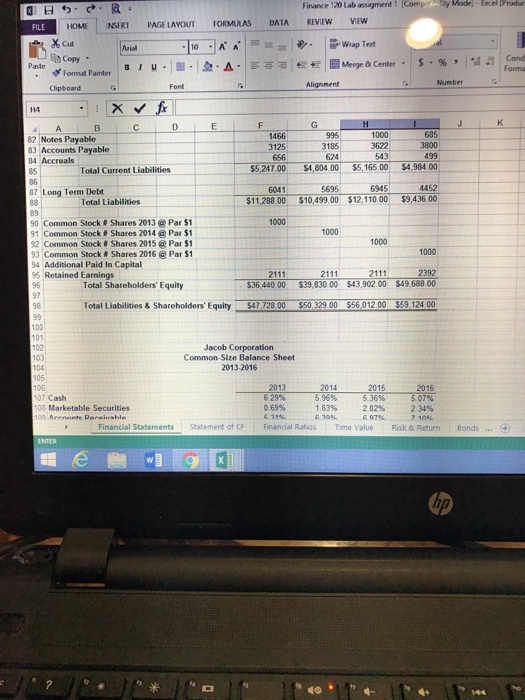
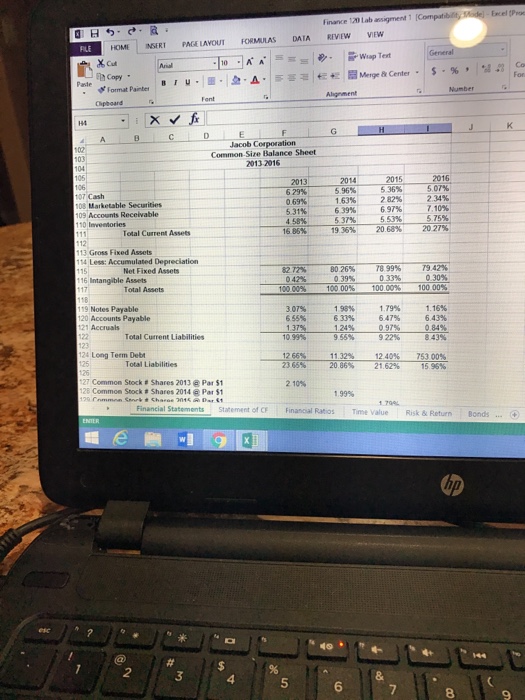
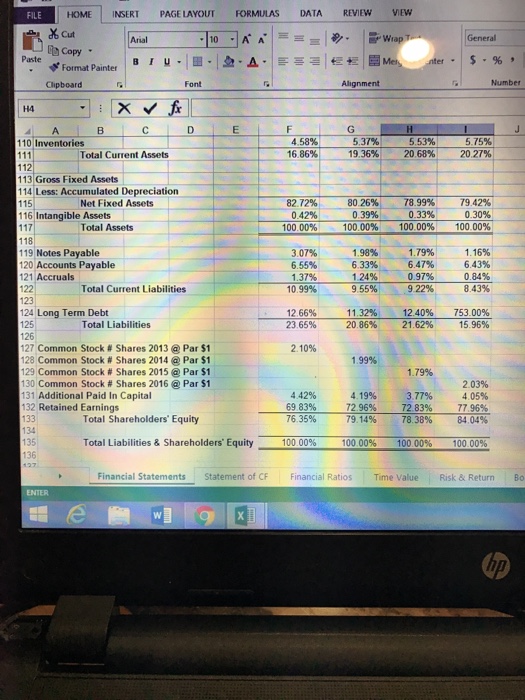
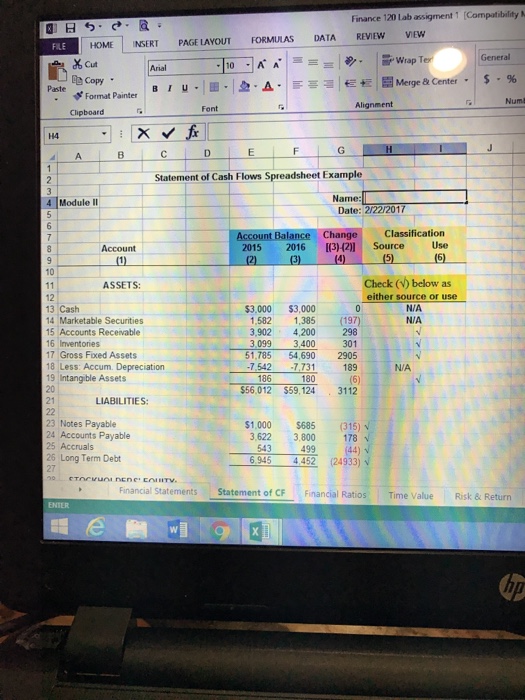
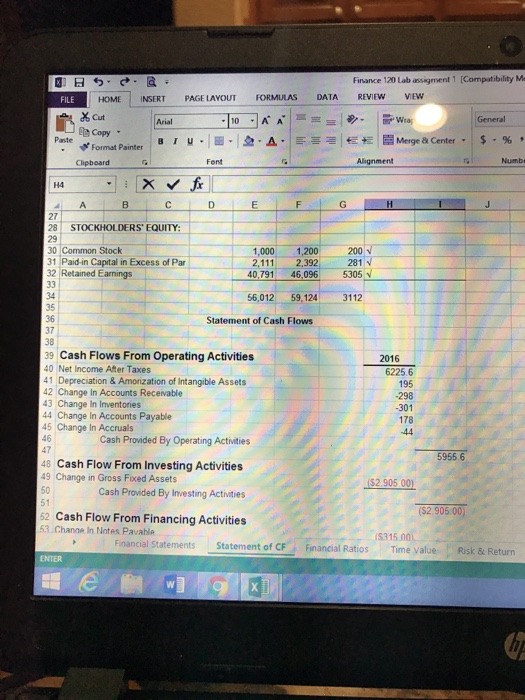
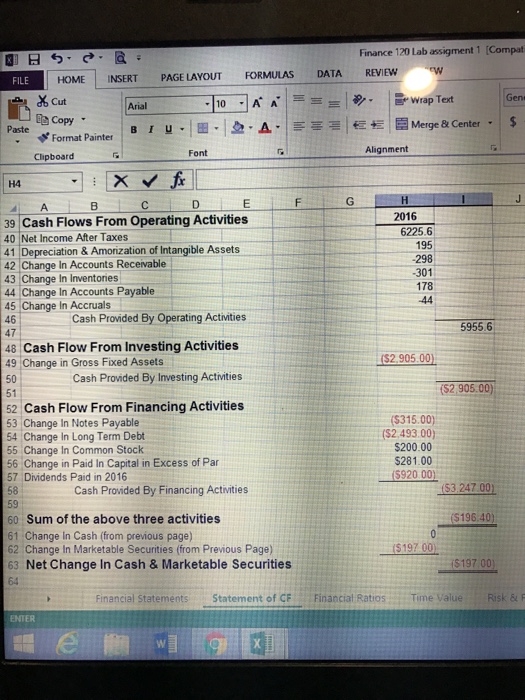
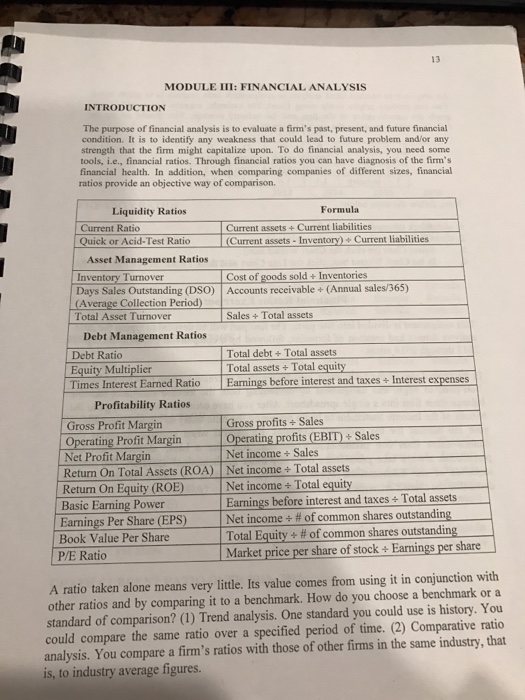
13 MODULE III: FINANCIAL ANALYSIS INTRODUCTION of financial analysis is to evaluate a firm's past, present, and future financial condition. It is to identify any weakness that could lead to future problem and or any strength that the firm might capitalize upon. To do financial analysis, you need some tools, i.e., financial ratios. Through financial ratios you can have diagnosis of the firm's financial health. In addition, when comparing companies of different sizes, financial ratios provide an objective way of comparison Formula Liquidity Ratios Current assets Current liabilitie Current Ratio Current assets Inventory) Current liabilities Quick or Acid-Test Ratio Asset Management Ratios Cost of goods sold Inventories Invent Days Sales Outstanding (DSO) Accounts receivable 4 (Annual sales365) Collection Period Sales Total assets Total Asset Turnover Debt Management Ratios Total debt. Total assets Debt Ratio Total assets Total equity Equity Multiplier Times Interest Earned Ratio Earnings before interest and taxes Interest expenses Profitability Ratios Gross profits Sales Gross Profit Margin Operating profits (EBIT Sales Operating Profit Margin Net income Sales Net Profit Margin Return On Total Assets (ROA) Net income Total assets Net income Total equity Return on Equity (ROE) Earnings before interest and taxes Total assets Basic Earning Power Net income +H of common shares outstanding Earnings Per Share (EPS) Total Equity of common shares outstanding Book Value Per Share Market price per share of stock Earningspershare P/E Ratio A ratio taken alone means very little. Its value comes from using it in conjunction with other ratios and by comparing it to a benchmark. How do you choose a benchmark or a tandard of comparison? (1) Trend analysis. One standard you could use is history. You could compare the same ratio over a specified period of time. (2) Comparative ratio analysis. You compare a firm's ratios with those of other firms in the same industry,that is, to industry average figures
Step by Step Solution
There are 3 Steps involved in it

Get step-by-step solutions from verified subject matter experts