

Question: please complete the trading multiples section for nike Reported Income Statement Fiscal Year Ending May 31 2017A 2018A 2019A $34,254.0 $36,363.0 $39,122.0 19,377.0 20,351.0 21,696.0
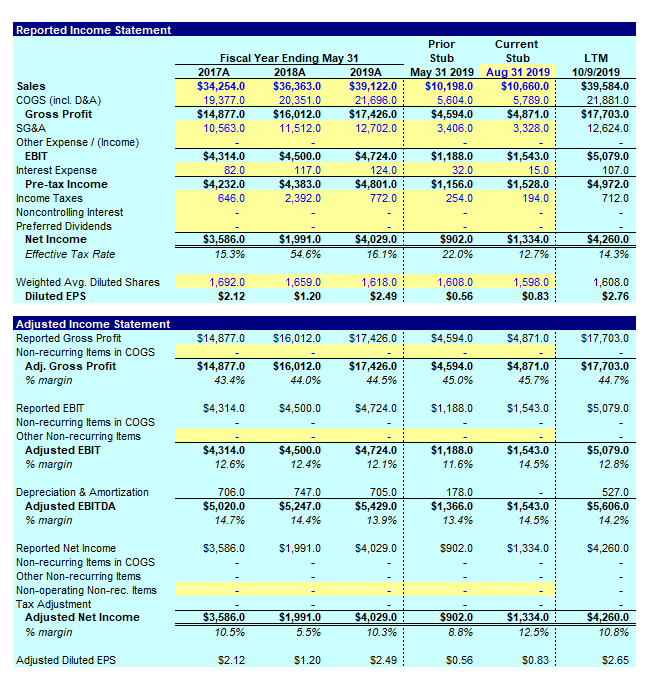 please complete the trading multiples section for nike
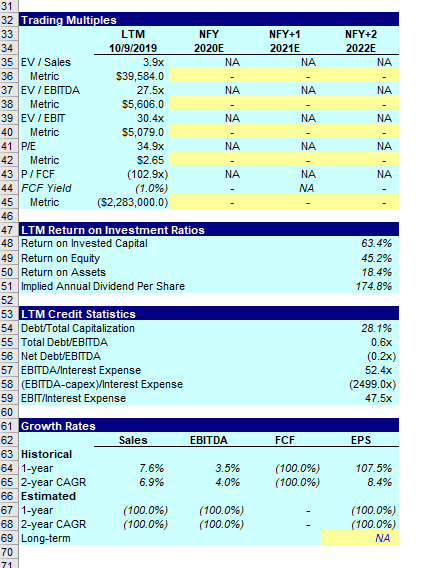
Reported Income Statement Fiscal Year Ending May 31 2017A 2018A 2019A $34,254.0 $36,363.0 $39,122.0 19,377.0 20,351.0 21,696.0 $14,877.0 $16,012.0 $17,426.0 10,563.0 11,512.0 12,702.0 Prior Current Stub Stub May 31 2019 Aug 31 2019 $10,198.0 $10,660.0 5,604.0 5,789.0 $4,594.0 $4,871.0 3,406.0 3,328.0 LTM 10/9/2019 $39,584.0 21,881.0 $17,703.0 12,624.0 Sales COGS (incl. D&A) Gross Profit SG&A Other Expense / Income) EBIT Interest Expense Pre-tax Income Income Taxes Noncontrolling Interest Preferred Dividends Net Income Effective Tax Rate $4,314.0 82.0 $4,232.0 646.0 $4,500.0 117.0 $4,383.0 $4.383.0 2,392.0 $4,724.0 124.0 $4,801.0 772.0 $1,188.0 32.0 $1,156.0 254.0 $1,543.0 15.0 $1,528.0 194.0 $5,079.0 107.0 $4,972.0 712.0 $3,586.0 15.3% $1,991.0 54.6% $4,029.0 16.1% $902.0 22.0% $1,334.0: 12.7% $4,260.0 14.3% 1 Weighted Avg. Diluted Shares Diluted EPS 1,692.0 $2.12 1,659.0 $1.20 1,618.01 $2.49 1.608. 0 $0.56 5980: $0.83 1,608.0 $2.76 $14,877.0 $16,012.0 $17,426.0 $4,594.0 $4,871.0 $17,703.0 Adjusted Income Statement Reported Gross Profit Non-recurring Items in COGS Adj. Gross Profit % margin $14,877.0 43.4% $16,012.0 44.0% $17,426.0 44.5% $4,594.0 45.0% $4,871.0 45.7% $17,703.0 44.7% $4,314.0 $4,500.0 $4,724.0 $1,188.0 $1,543.0 $5,079.0 Reported EBIT Non-recurring Items in COGS Other Non-recurring Items Adjusted EBIT % margin $4,314.0 12.6% $4,500.0 12.4% $4,724.0 12.1% $1,188.0 11.6% $1,543.0 14.5% $5,079.0 12.8% Depreciation & Amortization Adjusted EBITDA % margin 706.0 $5,020.0 14.7% 747.0 $5,247.0 14.4% 705.0 $5,429.0 13.9% 178.0 $1,366.0 13.4% $1,543.0 14.5% 527.0 $5,606.0 14.2% $3,586.0 $1,991.0 $4,029.0 $902.0 $1,334.0 $4,260.0 Reported Net Income Non-recurring Items in COGS Other Non-recurring Items Non-operating Non-rec. Items Tax Adjustment Adjusted Net Income % margin $3,586.0 10.5% $4,260.0 $1,991.0 5.5% $4,029.0 10.3% $902.0 8.8% $1,334.0 12.5% 10.8% Adjusted Diluted EPS $2.12 $1.20 $2.49 $0.56 $0.83 $2.65 N NFY 2020 FY+1 2021 NA NFY+2 2022E NA NA NA NA NA 32 Trading Multiples LTM 34 10/9/2019 35 EV / Sales 3.9x 36 Metric $39,584.0 37 EV / EBITDA 27.5x 38 Metric $5,606.0 39 EV / EBIT 30.4x 40 Metric $5,079.0 41 PIE 34.9x 42 Metric $2.65 43 P/FCF (102.9x) 44 FCF Yield (1.0%) 45 Metric ($2,283,000.0) NA NA NA NA NA NA NA NA NA 46 47 LTM Return on Investment Ratios 48 Return on invested Capital 49 Return on Equity 50 Return on Assets 51 Implied Annual Dividend Per Share 63.4% 45.2% 18.4% 174.8% 28.1% 0.6x (0.2x) 52.4x (2499.0x) 47.5x 53 LTM Credit Statistics 54 Debt/Total Capitalization 55 Total Debt/EBITDA 56 Net Debt/EBITDA 57 EBITDA/Interest Expense 58 (EBITDA-capex Interest Expense 59 EBIT/Interest Expense 60 61 Growth Rates Sales 63 Historical 64 1-year 7.6% 65 2-year CAGR 6.9% 66 Estimated 67 1-year (100.0%) 68 2-year CAGR (100.0%) 69 Long-term EBITDA FCF EPS 3.5% 4.0% (100.0%) (100.0%) 107.5% 8.4% (100.0%) (100.0%) (100.0%) (100.0%) NA Reported Income Statement Fiscal Year Ending May 31 2017A 2018A 2019A $34,254.0 $36,363.0 $39,122.0 19,377.0 20,351.0 21,696.0 $14,877.0 $16,012.0 $17,426.0 10,563.0 11,512.0 12,702.0 Prior Current Stub Stub May 31 2019 Aug 31 2019 $10,198.0 $10,660.0 5,604.0 5,789.0 $4,594.0 $4,871.0 3,406.0 3,328.0 LTM 10/9/2019 $39,584.0 21,881.0 $17,703.0 12,624.0 Sales COGS (incl. D&A) Gross Profit SG&A Other Expense / Income) EBIT Interest Expense Pre-tax Income Income Taxes Noncontrolling Interest Preferred Dividends Net Income Effective Tax Rate $4,314.0 82.0 $4,232.0 646.0 $4,500.0 117.0 $4,383.0 $4.383.0 2,392.0 $4,724.0 124.0 $4,801.0 772.0 $1,188.0 32.0 $1,156.0 254.0 $1,543.0 15.0 $1,528.0 194.0 $5,079.0 107.0 $4,972.0 712.0 $3,586.0 15.3% $1,991.0 54.6% $4,029.0 16.1% $902.0 22.0% $1,334.0: 12.7% $4,260.0 14.3% 1 Weighted Avg. Diluted Shares Diluted EPS 1,692.0 $2.12 1,659.0 $1.20 1,618.01 $2.49 1.608. 0 $0.56 5980: $0.83 1,608.0 $2.76 $14,877.0 $16,012.0 $17,426.0 $4,594.0 $4,871.0 $17,703.0 Adjusted Income Statement Reported Gross Profit Non-recurring Items in COGS Adj. Gross Profit % margin $14,877.0 43.4% $16,012.0 44.0% $17,426.0 44.5% $4,594.0 45.0% $4,871.0 45.7% $17,703.0 44.7% $4,314.0 $4,500.0 $4,724.0 $1,188.0 $1,543.0 $5,079.0 Reported EBIT Non-recurring Items in COGS Other Non-recurring Items Adjusted EBIT % margin $4,314.0 12.6% $4,500.0 12.4% $4,724.0 12.1% $1,188.0 11.6% $1,543.0 14.5% $5,079.0 12.8% Depreciation & Amortization Adjusted EBITDA % margin 706.0 $5,020.0 14.7% 747.0 $5,247.0 14.4% 705.0 $5,429.0 13.9% 178.0 $1,366.0 13.4% $1,543.0 14.5% 527.0 $5,606.0 14.2% $3,586.0 $1,991.0 $4,029.0 $902.0 $1,334.0 $4,260.0 Reported Net Income Non-recurring Items in COGS Other Non-recurring Items Non-operating Non-rec. Items Tax Adjustment Adjusted Net Income % margin $3,586.0 10.5% $4,260.0 $1,991.0 5.5% $4,029.0 10.3% $902.0 8.8% $1,334.0 12.5% 10.8% Adjusted Diluted EPS $2.12 $1.20 $2.49 $0.56 $0.83 $2.65 N NFY 2020 FY+1 2021 NA NFY+2 2022E NA NA NA NA NA 32 Trading Multiples LTM 34 10/9/2019 35 EV / Sales 3.9x 36 Metric $39,584.0 37 EV / EBITDA 27.5x 38 Metric $5,606.0 39 EV / EBIT 30.4x 40 Metric $5,079.0 41 PIE 34.9x 42 Metric $2.65 43 P/FCF (102.9x) 44 FCF Yield (1.0%) 45 Metric ($2,283,000.0) NA NA NA NA NA NA NA NA NA 46 47 LTM Return on Investment Ratios 48 Return on invested Capital 49 Return on Equity 50 Return on Assets 51 Implied Annual Dividend Per Share 63.4% 45.2% 18.4% 174.8% 28.1% 0.6x (0.2x) 52.4x (2499.0x) 47.5x 53 LTM Credit Statistics 54 Debt/Total Capitalization 55 Total Debt/EBITDA 56 Net Debt/EBITDA 57 EBITDA/Interest Expense 58 (EBITDA-capex Interest Expense 59 EBIT/Interest Expense 60 61 Growth Rates Sales 63 Historical 64 1-year 7.6% 65 2-year CAGR 6.9% 66 Estimated 67 1-year (100.0%) 68 2-year CAGR (100.0%) 69 Long-term EBITDA FCF EPS 3.5% 4.0% (100.0%) (100.0%) 107.5% 8.4% (100.0%) (100.0%) (100.0%) (100.0%) NA
Step by Step Solution
There are 3 Steps involved in it

Get step-by-step solutions from verified subject matter experts