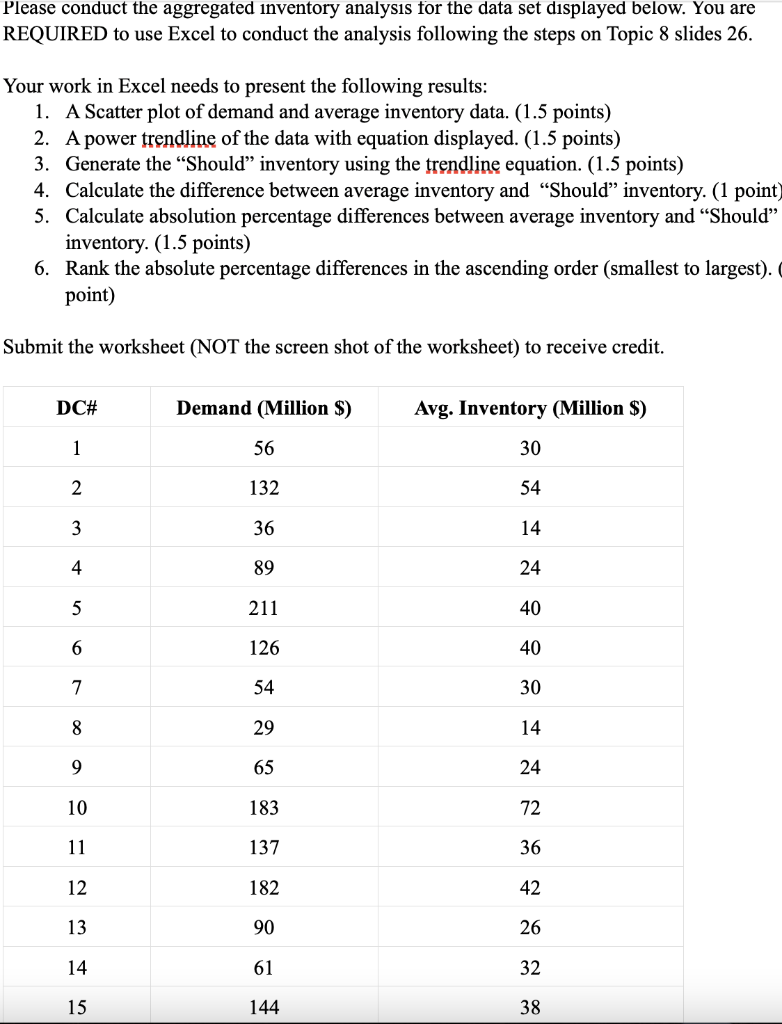
Question: Please conduct the aggregated inventory analysis for the data set displayed below. You are REQUIRED to use Excel to conduct the analysis following the steps

Please conduct the aggregated inventory analysis

Please conduct the aggregated inventory analysis for the data set displayed below. You are REQUIRED to use Excel to conduct the analysis following the steps on Topic 8 slides 26. Your work in Excel needs to present the following results: 1. A Scatter plot of demand and average inventory data. (1.5 points) 2. A power trendline of the data with equation displayed. (1.5 points) 3. Generate the Should inventory using the trendline equation. (1.5 points) 4. Calculate the difference between average inventory and Should inventory. (1 point) 5. Calculate absolution percentage differences between average inventory and Should inventory. (1.5 points) 6. Rank the absolute percentage differences in the ascending order (smallest to largest). point) Submit the worksheet (NOT the screen shot of the worksheet) to receive credit. DC# Demand (Million $) Avg. Inventory (Million $) 1 56 30 2 132 54 3 36 14 4 89 24 5 211 40 6 126 40 7 54 30 8 29 14 9 65 24 10 183 72 11 137 36 12 182 42 13 90 26 14 61 32 15 144 38

Step by Step Solution

There are 3 Steps involved in it

1 Expert Approved Answer
Step: 1 Unlock blur-text-image
Question Has Been Solved by an Expert!

Get step-by-step solutions from verified subject matter experts

Step: 2 Unlock
Step: 3 Unlock

Students Have Also Explored These Related General Management Questions!