

Question: Please consider the data for SKUs X, Y, and Z. The store currently carries SKUs X and Y. The store manager considers discontinuing SKUs X
Please consider the data for SKUs X, Y, and Z. The store currently carries SKUs X and Y. The store manager considers discontinuing SKUs X and Y in favor of a new SKU Z, expecting that all consumers will be willing to switch from X/Y to Z. Please answer the following questions to help him decide (assuming a managerial R, Q policy is in place):
a) What is the minimum degree of substitutability (g) between SKUs X and Z as well as between SKUs Y and Z, respectively, that must be achieved to maintain profits after SKU rationalization at the same level as before SKU rationalization?
b) Let the true degree of substitutability be 92%. How will total profits change (in $ terms) after SKU rationalization?
c) If the degree of substitution is 92%, how will total inventories (the sum of cycle stocks and safety stocks) change after SKU rationalization?
d) Explain the THREE reasons for the inventory reduction identified in Q.1c above.
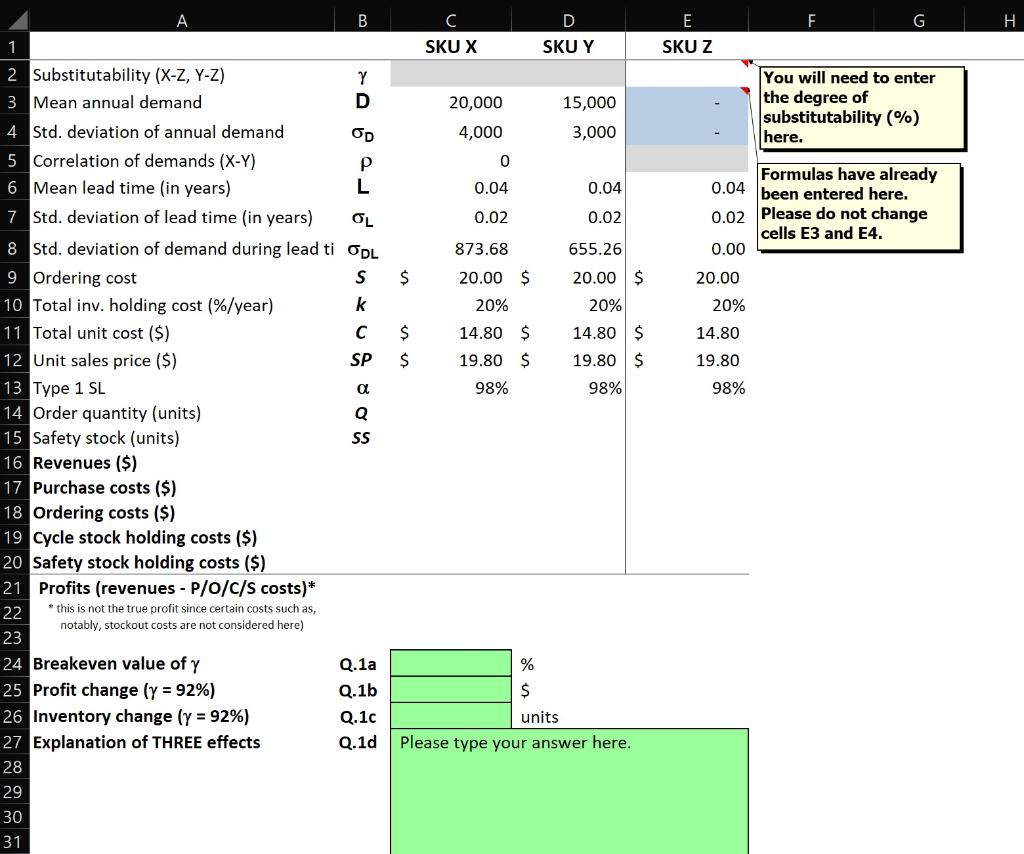
A B E F G D SKU Y 1 SKU X SKUZ 20,000 4,000 15,000 3,000 You will need to enter the degree of substitutability (%) here. 0 0.04 0.04 0.02 0.02 Formulas have already 0.04 been entered here. 0.02 Please do not change cells E3 and E4. 0.00 873.68 655.26 $ 20.00 20.00 $ 20% 20% $ 20.00 $ 20% 14.80 $ 19.80 $ 98% 14.80 $ 14.80 $ 19.80 $ 98% 19.80 98% 2 Substitutability (X-Z, Y-Z) Y 3 Mean annual demand D 4 Std. deviation of annual demand OD 5 Correlation of demands (X-Y) 6 Mean lead time (in years) L 7 Std. deviation of lead time (in years) OL 8 Std. deviation of demand during lead ti ODL 9 Ordering cost S 10 Total inv. holding cost (%/year) k 11 Total unit cost ($) 12 Unit sales price ($) SP 13 Type 1 SL a 14 Order quantity (units) Q 15 Safety stock (units) SS 16 Revenues ($) 17 Purchase costs ($) 18 Ordering costs ($) 19 Cycle stock holding costs ($) 20 Safety stock holding costs ($) 21 Profits (revenues - P/o/c/s costs)* 22 this is not the true profit since certain costs such as, notably, stockout costs are not considered here) 23 24 Breakeven value of y Q.1a 25 Profit change (y = 92%) Q.1b 26 Inventory change (y = 92%) Q.1c 27 Explanation of THREE effects Q.1d 28 % $ units Please type your answer here. 29 30 31 A B E F G D SKU Y 1 SKU X SKUZ 20,000 4,000 15,000 3,000 You will need to enter the degree of substitutability (%) here. 0 0.04 0.04 0.02 0.02 Formulas have already 0.04 been entered here. 0.02 Please do not change cells E3 and E4. 0.00 873.68 655.26 $ 20.00 20.00 $ 20% 20% $ 20.00 $ 20% 14.80 $ 19.80 $ 98% 14.80 $ 14.80 $ 19.80 $ 98% 19.80 98% 2 Substitutability (X-Z, Y-Z) Y 3 Mean annual demand D 4 Std. deviation of annual demand OD 5 Correlation of demands (X-Y) 6 Mean lead time (in years) L 7 Std. deviation of lead time (in years) OL 8 Std. deviation of demand during lead ti ODL 9 Ordering cost S 10 Total inv. holding cost (%/year) k 11 Total unit cost ($) 12 Unit sales price ($) SP 13 Type 1 SL a 14 Order quantity (units) Q 15 Safety stock (units) SS 16 Revenues ($) 17 Purchase costs ($) 18 Ordering costs ($) 19 Cycle stock holding costs ($) 20 Safety stock holding costs ($) 21 Profits (revenues - P/o/c/s costs)* 22 this is not the true profit since certain costs such as, notably, stockout costs are not considered here) 23 24 Breakeven value of y Q.1a 25 Profit change (y = 92%) Q.1b 26 Inventory change (y = 92%) Q.1c 27 Explanation of THREE effects Q.1d 28 % $ units Please type your answer here. 29 30 31
Step by Step Solution
There are 3 Steps involved in it

Get step-by-step solutions from verified subject matter experts