

Question: Please construct an X BAR CHART & R CHART & show how you input it into excel and what the process for obtaining the graphs
Please construct an X BAR CHART & R CHART & show how you input it into excel and what the process for obtaining the graphs is through excel
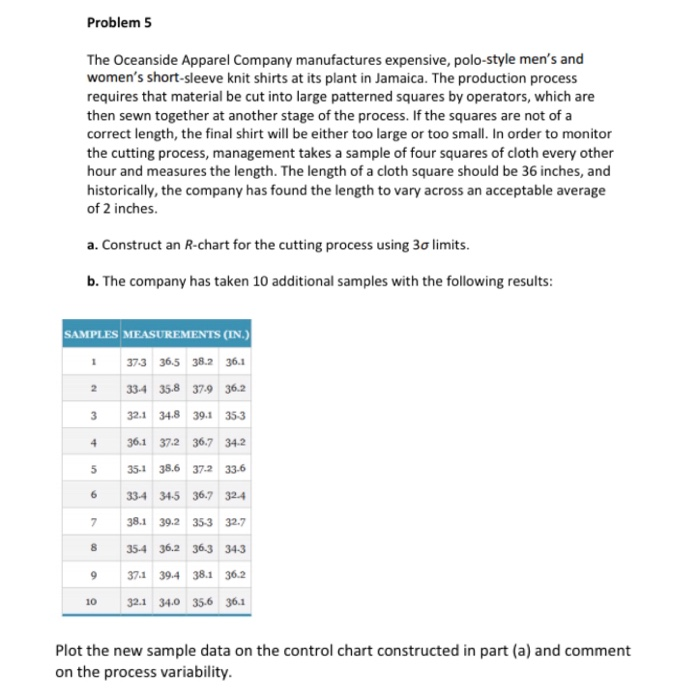
The Oceanside Apparel Company manufactures expensive, polo-style men's and women's short-sleeve knit shirts at its plant in Jamaica. The production process requires that material be cut into large patterned squares by operators, which are then sewn together at another stage of the process. If the squares are not of a correct length, the final shirt will be either too large or too small. In order to monitor the cutting process, management takes a sample of four squares of cloth every other hour and measures the length. The length of a cloth square should be 36 inches, and historically, the company has found the length to vary across an acceptable average of 2 inches. a. Construct an R-chart for the cutting process using 3 limits. b. The company has taken 10 additional samples with the following results: Plot the new sample data on the control chart constructed in part (a) and comment on the process variabilityStep by Step Solution
There are 3 Steps involved in it
1 Expert Approved Answer
Step: 1 Unlock

Question Has Been Solved by an Expert!
Get step-by-step solutions from verified subject matter experts
Step: 2 Unlock
Step: 3 Unlock