

Question: Please copy and paste into excel. Thank you for your help! Date Revenue Feb-14 3519756 Mar-14 4092575 Apr-14 4980992 May-14 5273355 Jun-14 5715707 Jul-14 6522085
Please copy and paste into excel. Thank you for your help!
Date Revenue
Feb-14 3519756
Mar-14 4092575
Apr-14 4980992
May-14 5273355
Jun-14 5715707
Jul-14 6522085
Aug-14 7407450
Sep-14 7741167
Oct-14 7232870
Nov-14 7642800
Dec-14 7465568
Jan-15 8558141
Feb-15 8802295
Mar-15 9099395
Apr-15 9979643
May-15 10617311
Jun-15 11326452
Jul-15 10856584
Aug-15 12811437
Sep-15 13181758
Oct-15 11656736
Nov-15 11290012
Dec-15 12231410
Jan-16 13247434
Feb-16 12466617
Mar-16 14195923
Apr-16 13097298
May-16 17183162
Jun-16 14482648
Jul-16 16823849
Aug-16 17574149
Sep-16 19145992
Oct-16 19266922
Nov-16 18425864
Dec-16 17694953
Jan-17 18164787
Feb-17 17723858
Mar-17 17550692
Apr-17 22867587
May-17 18563939
Jun-17 19662464
Jul-17 20437751
Aug-17 23775043
Sep-17 23235507
Oct-17 23098408
Nov-17 21076993
Dec-17 21211445
Jan-18 21681438
Feb-18 21134864
Mar-18 20871820
Apr-18 22947141
May-18 22367707
Jun-18 21928692
Jul-18 22963778
Aug-18 23044818
Sep-18 23770397
Oct-18 22589679
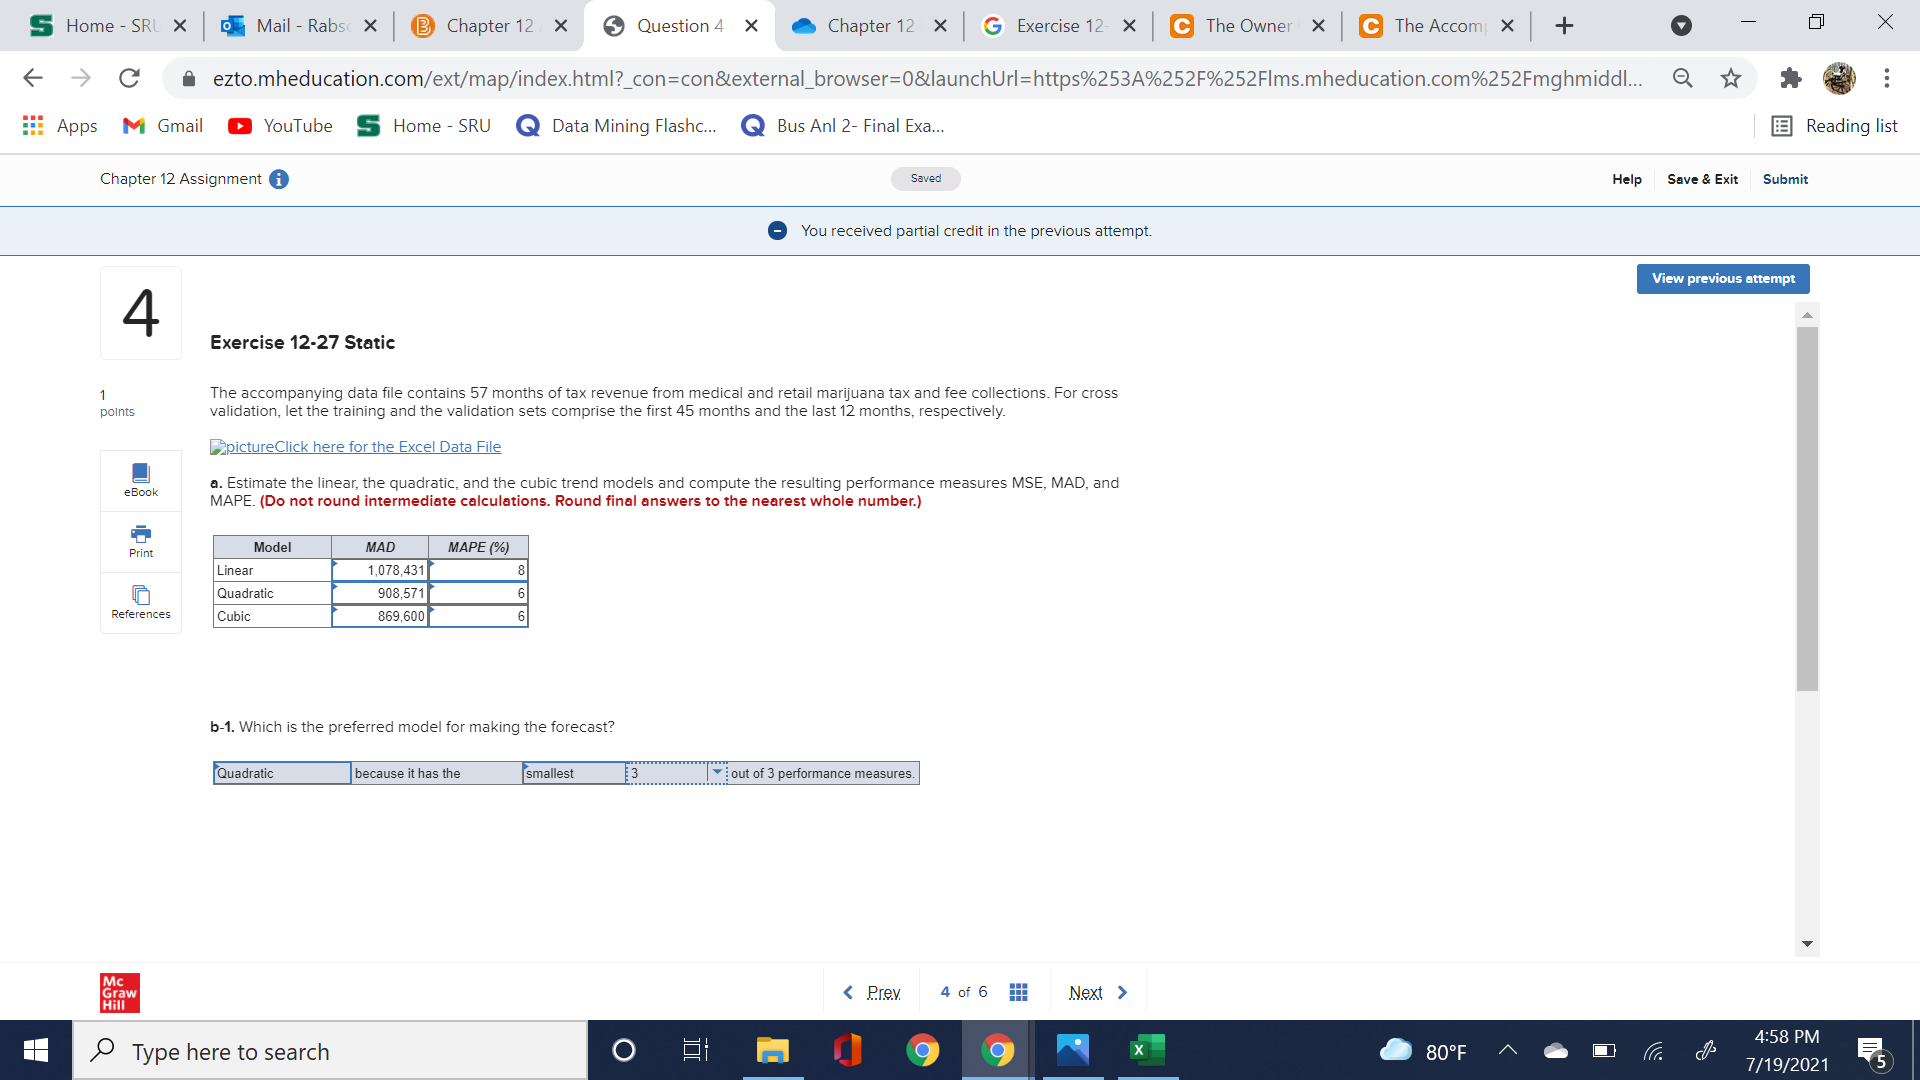
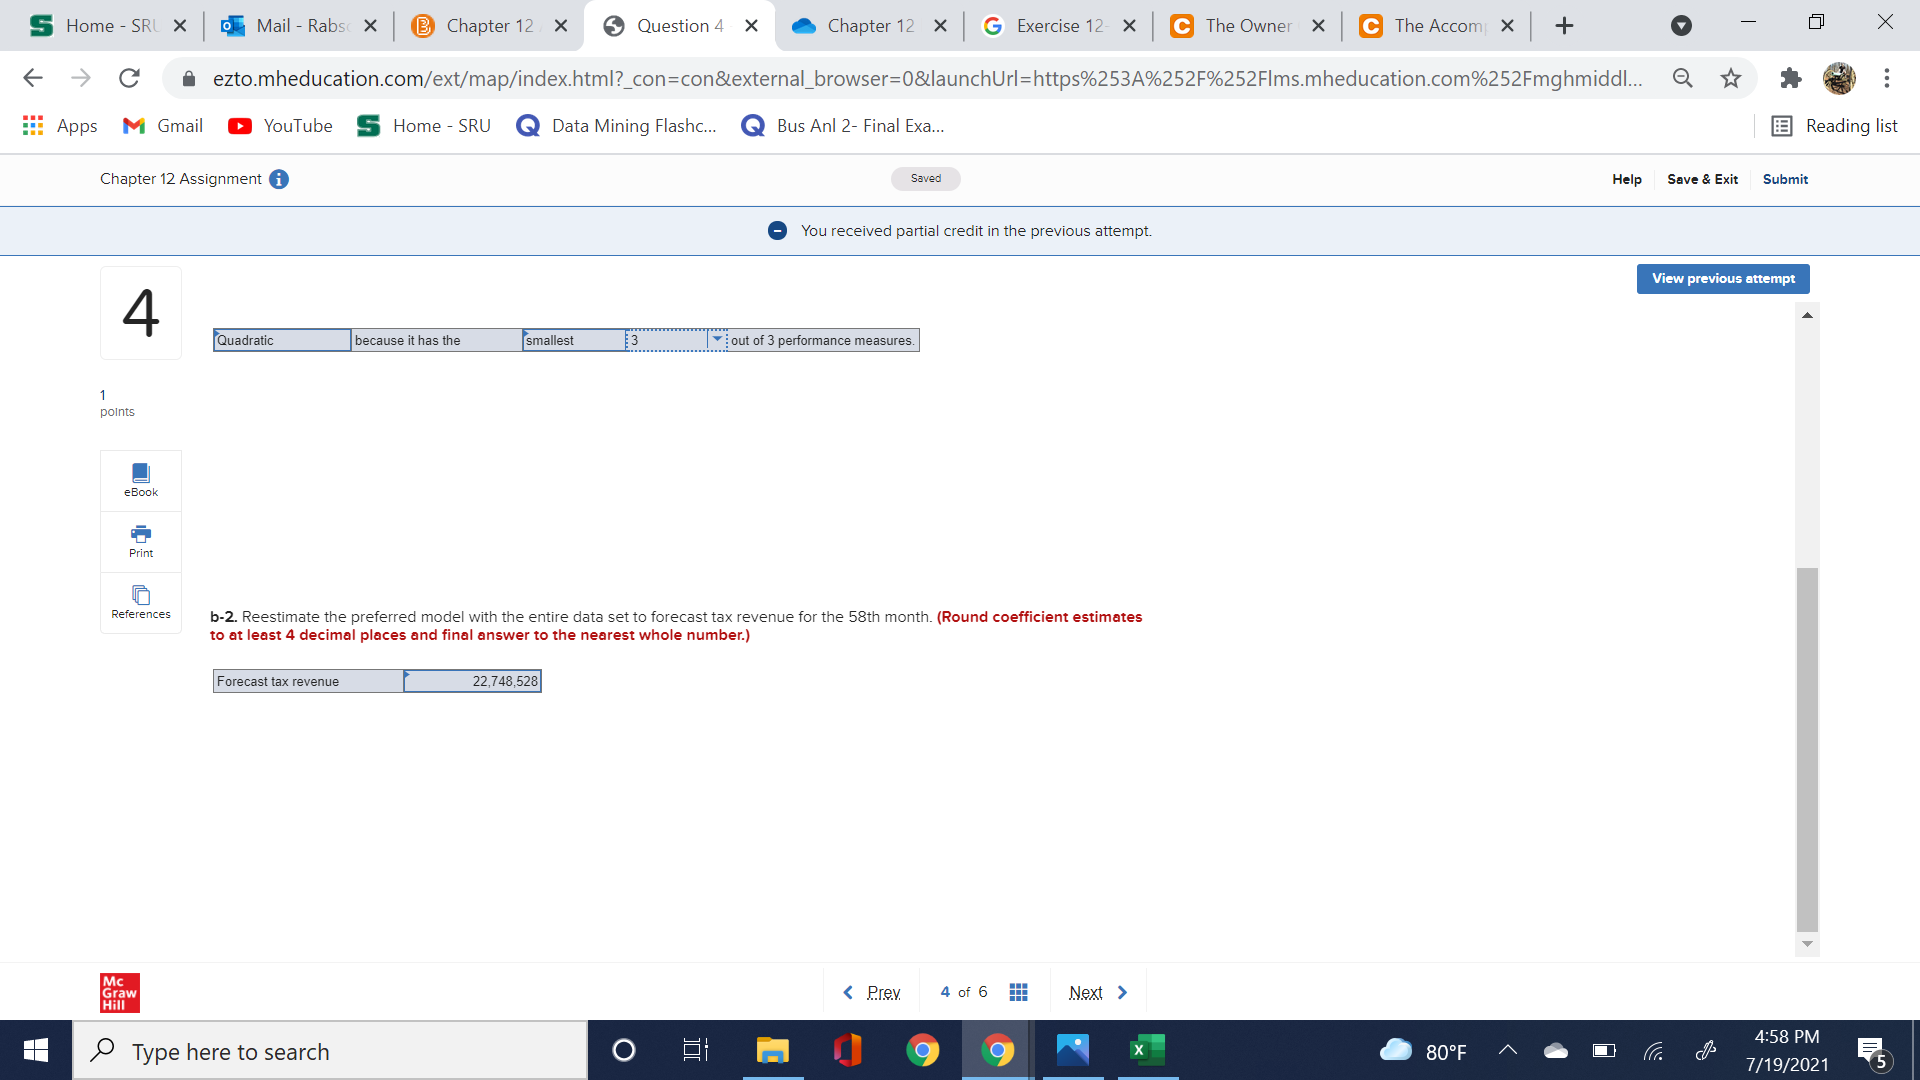
5 Home - SRL X Mail - Rabs( X B Chapter 12 X Question 4 X Chapter 12 X G Exercise 12- X C The Owner X C The Accomp X + X C ^ ezto.mheducation.com/ext/map/index.html?_con=con&external_browser=0&launchUrl=https%253A%252F%252FIms.mheducation.com%252Fmghmiddle.. Apps M Gmail YouTube S Home - SRU @ Data Mining Flashc... @ Bus Anl 2- Final Exa... Reading list Chapter 12 Assignment i Saved Help Save & Exit Submit You received partial credit in the previous attempt. View previous attempt Exercise 12-27 Static 1 The accompanying data file contains 57 months of tax revenue from medical and retail marijuana tax and fee collections. For cross points validation, let the training and the validation sets comprise the first 45 months and the last 12 months, respectively. ApictureClick here for the Excel Data File Book a. Estimate the linear, the quadratic, and the cubic trend models and compute the resulting performance measures MSE, MAD, and MAPE. (Do not round intermediate calculations. Round final answers to the nearest whole number.) Print Model MAD MAPE (%) Linear ,078,431 Co Quadratic 908,571 References Cubic 869,600 6 b-1. Which is the preferred model for making the forecast? Quadratic because it has the smallest 13.. !.out of 3 performance measures. MC Type here to search Omg 4:58 PM O 80OF 7/19/2021 FE5 Home - SRL X Mail - Rabs( X B Chapter 12 X Question 4 X Chapter 12 X G Exercise 12- X C The Owner X C The Accomp X + X C ^ ezto.mheducation.com/ext/map/index.html?_con=con&external_browser=0&launchUrl=https%253A%252F%252FIms.mheducation.com%252Fmghmiddle.. Apps M Gmail YouTube S Home - SRU @ Data Mining Flashc... @ Bus Anl 2- Final Exa... Reading list Chapter 12 Assignment Saved Help Save & Exit Submit You received partial credit in the previous attempt. View previous attempt 4 Quadratic because it has the smallest .!out of 3 performance measures. 1 points Book Print n References b-2. Reestimate the preferred model with the entire data set to forecast tax revenue for the 58th month. (Round coefficient estimates to at least 4 decimal places and final answer to the nearest whole number.) Forecast tax revenue 22,748,528 MC Type here to search Omg 4:58 PM O 80OF 7/19/2021 FE
Step by Step Solution
There are 3 Steps involved in it

Get step-by-step solutions from verified subject matter experts