

Question: please correct answer Part 2: Answer All Questions la. Prepare Comparative Statements - Balance Sheet and Income Statement, using VERTICAL ANALYSIS for the following data:
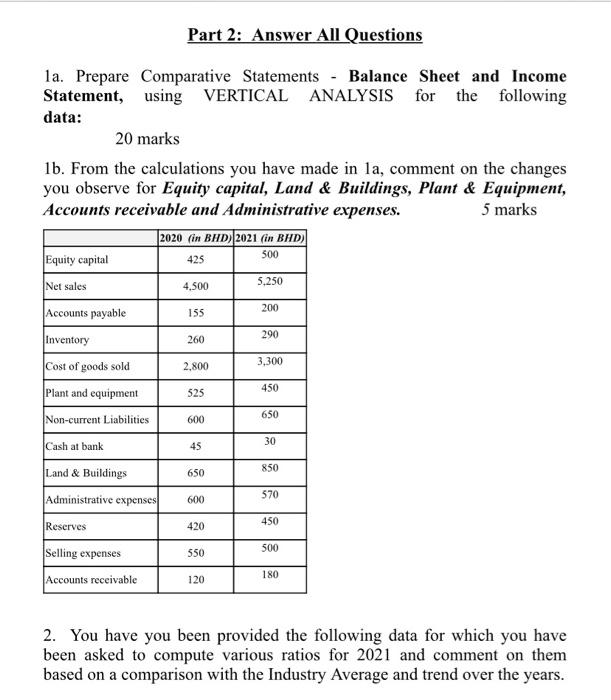
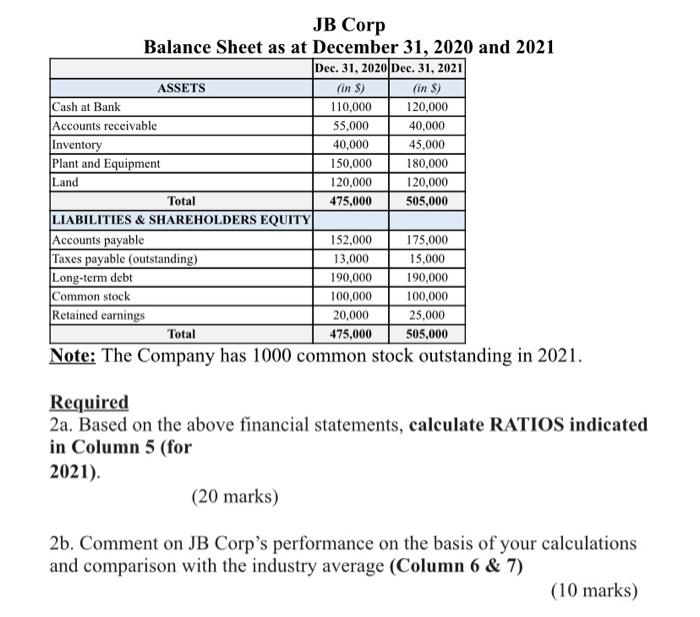
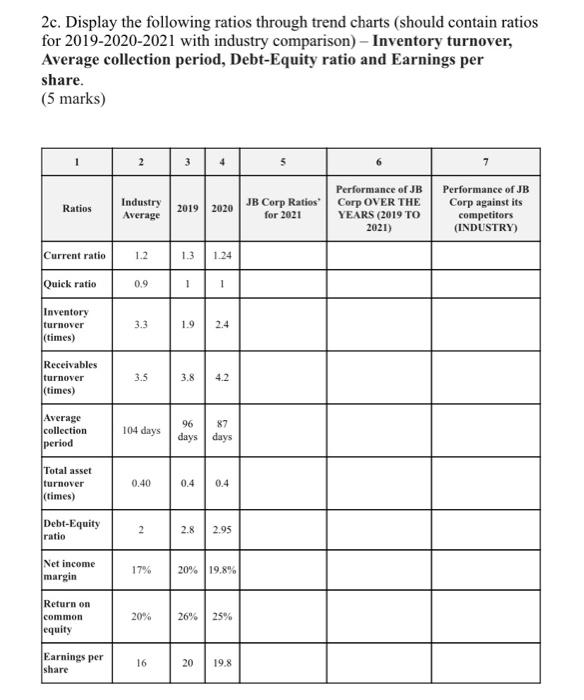
Part 2: Answer All Questions la. Prepare Comparative Statements - Balance Sheet and Income Statement, using VERTICAL ANALYSIS for the following data: 20 marks 1b. From the calculations you have made in la, comment on the changes you observe for Equity capital, Land & Buildings, Plant & Equipment, Accounts receivable and Administrative expenses. 5 marks 2020 (in BHD) |2021 (in BHD) 425 500 4,500 5.250 155 200 260 290 Equity capital Net sales Accounts payable Inventory Cost of goods sold Plant and equipment Non-current Liabilities 2.800 3,300 525 450 650 600 30 Cash at bank 45 850 650 Land & Buildings Administrative expenses 570 600 450 Reserves 420 550 500 Selling expenses Accounts receivable 180 120 2. You have you been provided the following data for which you have been asked to compute various ratios for 2021 and comment on them based on a comparison with the Industry Average and trend over the years. JB Corp Balance Sheet as at December 31, 2020 and 2021 Dec. 31, 2020 Dec. 31, 2021 ASSETS (in $) (in ) Cash at Bank 110,000 120,000 Accounts receivable 55,000 40,000 Inventory 40,000 45,000 Plant and Equipment 150,000 180,000 Land 120,000 120,000 Total 475,000 505,000 LIABILITIES & SHAREHOLDERS EQUITY Accounts payable 152,000 175,000 Taxes payable (outstanding) 13,000 15,000 Long-term debt 190,000 190,000 Common stock 100,000 100,000 Retained earnings 20,000 25,000 Total 475,000 505,000 Note: The Company has 1000 common stock outstanding in 2021. Required 2a. Based on the above financial statements, calculate RATIOS indicated in Column 5 (for 2021). (20 marks) 2b. Comment on JB Corp's performance on the basis of your calculations and comparison with the industry average (Column 6 & 7) (10 marks) 2c. Display the following ratios through trend charts (should contain ratios for 2019-2020-2021 with industry comparison) - Inventory turnover, Average collection period, Debt-Equity ratio and Earnings per share. (5 marks) 2 3 4 7 Ratios Industry Average 2019 2020 JB Corp Ratios for 2021 Performance of JB Corp OVER THE YEARS (2019 TO 2021) Performance of JB Corp against its competitors (INDUSTRY) Current ratio 1.2 1.3 1.24 Quick ratio 0.9 1 1 Inventory turnover (times) 3.3 1.9 2.4 Receivables turnover (times) 3.5 3.8 4.2 Average collection period 104 days 96 days 87 days Total asset turnover (times) 0.40 0.4 0.4 Debt-Equity ratio 2 2.8 2.95 Net income margin 17% 20% 19.8% Return on common equity 20% 26% 25% Earnings per share 16 20 19.8
Step by Step Solution
There are 3 Steps involved in it

Get step-by-step solutions from verified subject matter experts