

Question: Please could someone show me how to solve this matlab problem. Thanks Please could someone show me how to solve the yellow part of this
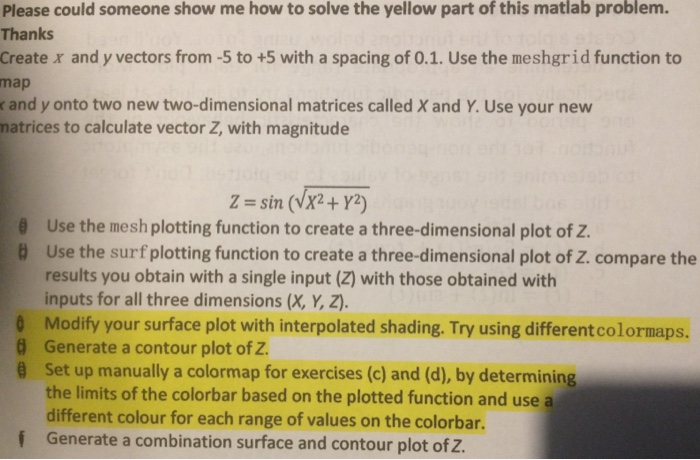
Please could someone show me how to solve the yellow part of this matlab problem. Thanks Create x and y vectors from -5 to +5 with a spacing of 0.1. Use the meshgrid function to map r and y onto two new two-dimensional matrices called X and Y. Use your new natrices to calculate vector Z, with magnitude z = sin (NX2 + Y2) 0 Use the mesh plotting function to create a three-dimensional plot of Z Use the surf plotting function to create a three-dimensional plot of Z, compare the results you obtain with a single input (Z) with those obtained with inputs for all three dimensions (X, Y, Z). 0 Modify your surface plot with interpolated shading. Try using differentcolormaps. g Generate a contour plot of Z e Set up manually a colormap for exercises (c) and (d), by determining the limits of the colorbar based on the plotted function and use a different colour for each range of values on the colorbar. Generate a combination surface and contour plot of 2
Step by Step Solution
There are 3 Steps involved in it

Get step-by-step solutions from verified subject matter experts